Arctic April 2025 Climate Summary
Sea ice "recovery" and regionally wet

Both temperatures and precipitation were above normal for the Arctic overall, with pronounced region extremes, but the most notable feature of April 2025 was the comparative recovery of sea ice extent after being at or near record low levels during the previous four months.
Temperature
April was another mild month for the Arctic overall, with 70 percent of the Arctic (land and seas north of 60°N) having average temperatures above the above normal. The most notable feature in Fig. 1 is the large area in eastern Siberia that was much warmer than the 1991-2020 average. The huge Sakha Republic of eastern Siberia had the second highest April average temperature since 1950 (only 2014 milder). This part of the Asian Arctic is especially susceptible to wildfire and a near record April jumpstarts snowmelt and drying of the boreal forest.

Parts of northwest North America were also quite mild, with Canada’s Yukon Territory finishing with the fourth mildest April, and that warmth extended into the southeast Alaska Interior. Northeast Greenland eastward to Svalbard were notably cooler than normal, and for Svalbard this was the coolest April since 2009. Small areas in Nunavut, Canada and northwest Alaska were also notably cooler than the 1991-2020 average.
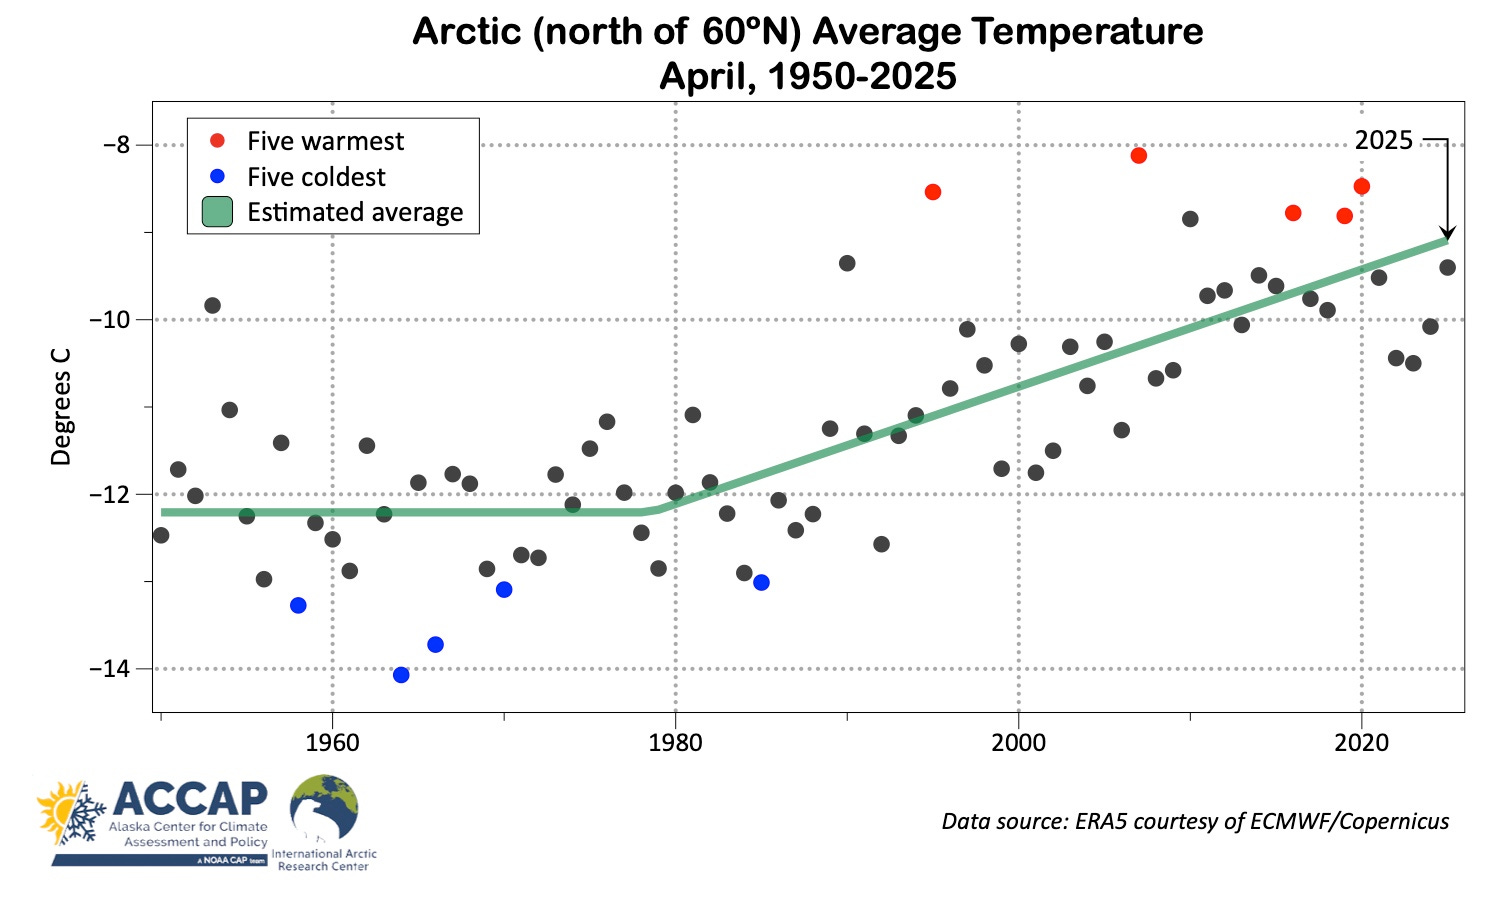
Figure 2 plots the April average temperature time series. For the Arctic overall, this was the mildest April since 2020 and eighth warmest since 1950. The trend since the early 1980s totals about 3°C warming for the April average temperature.
Precipitation
April is climatologically the driest month of the year for the Arctic, with a large part of the Pacific side of the North Pole averaging less than 10mm total. While 55 percent of the Arctic had less than the 1991-2020 average precipitation in April, Fig. 3 highlights areas with two to four times the average, including wide swath of the Eurasian Arctic and in Alaska, where this month had the highest April precipitation (from ERA5 reanalysis) since 1950. Overall for the Arctic, this was the seventh highest April total since 1950.

Sea ice
After running at or near record low extent for much of the winter and early Spring, sea ice loss in April was much less than usual. The average ice extent for the month is shown in Fig. 4. While December 2024, February 2025 and March 2025 all had the lowest average ice extent in the 47 year satellite record, April extent ranking was not nearly as low and was tied for ninth lowest. Nonetheless, the extent this April was lower than the April extent in the previous three years.
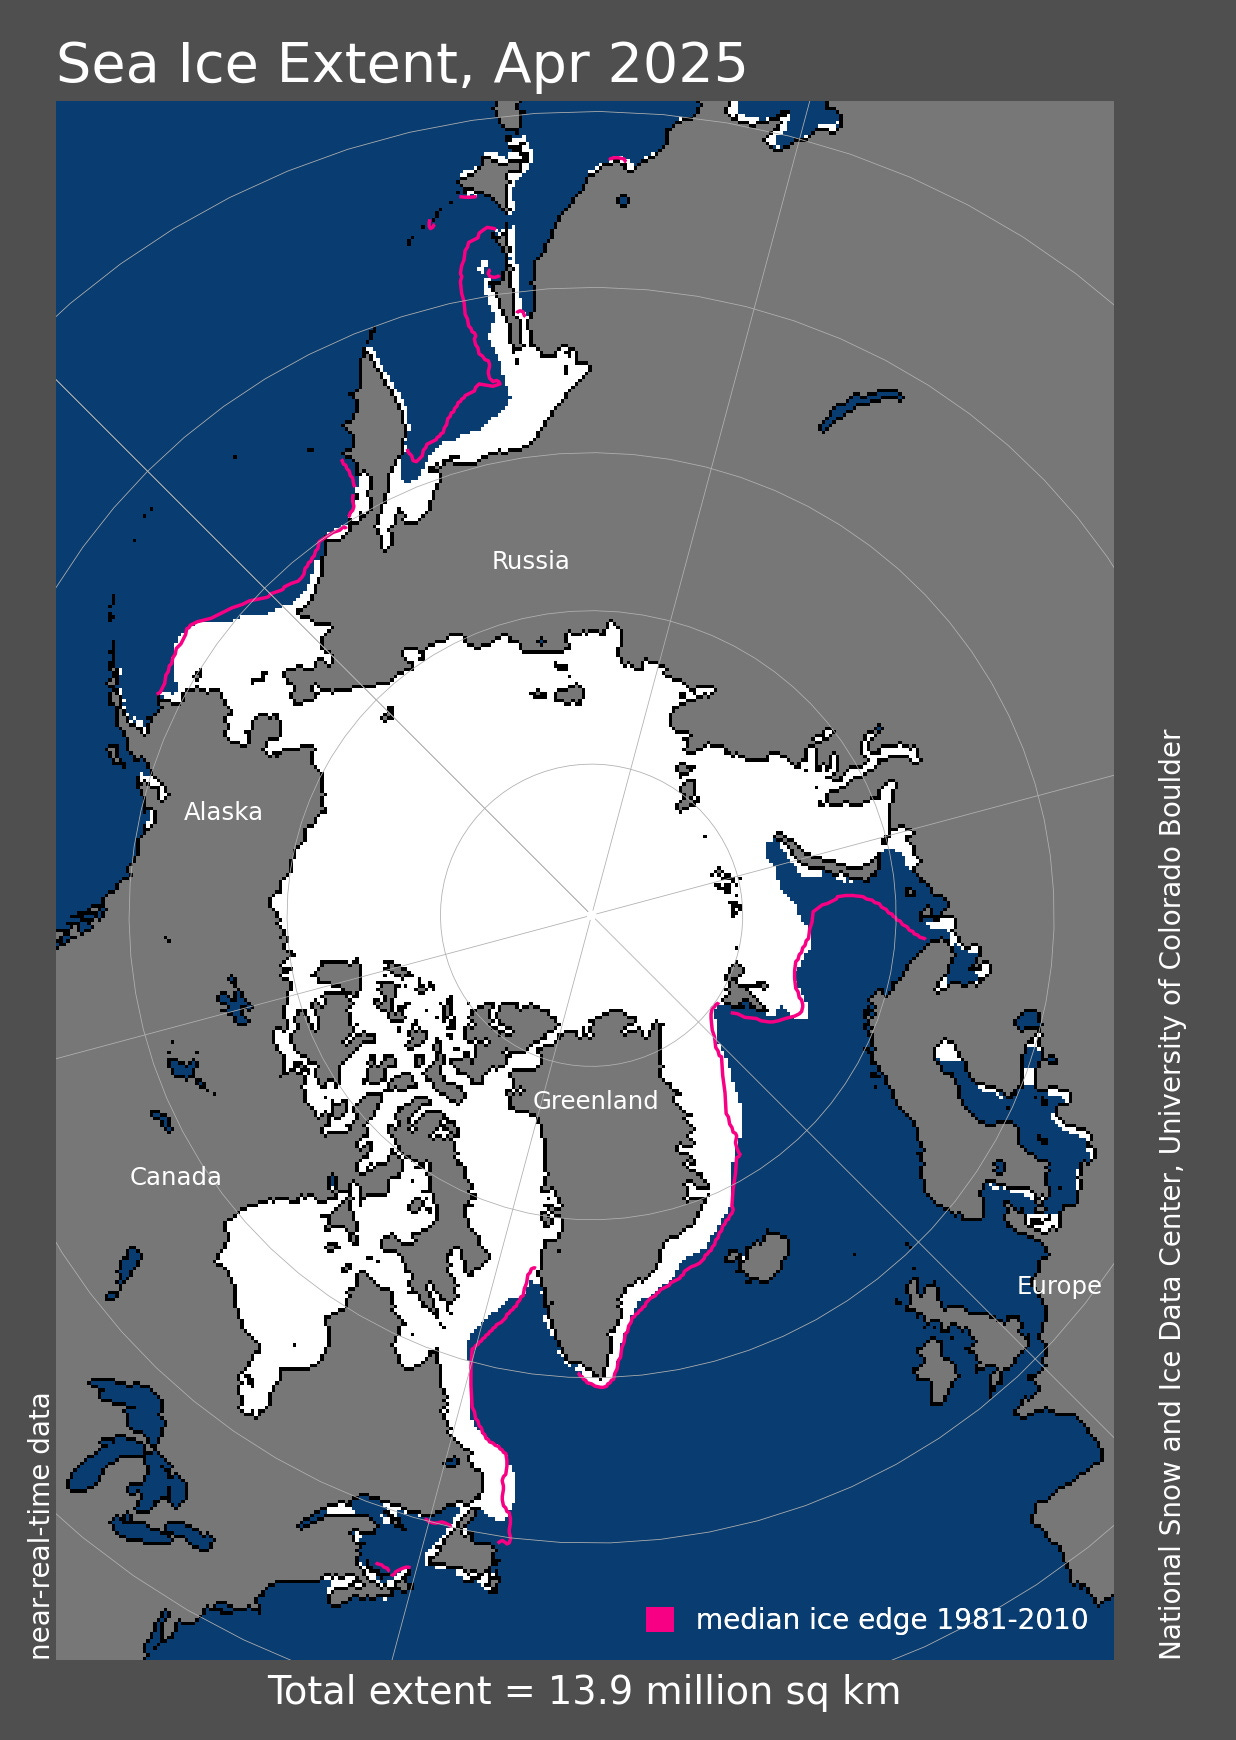
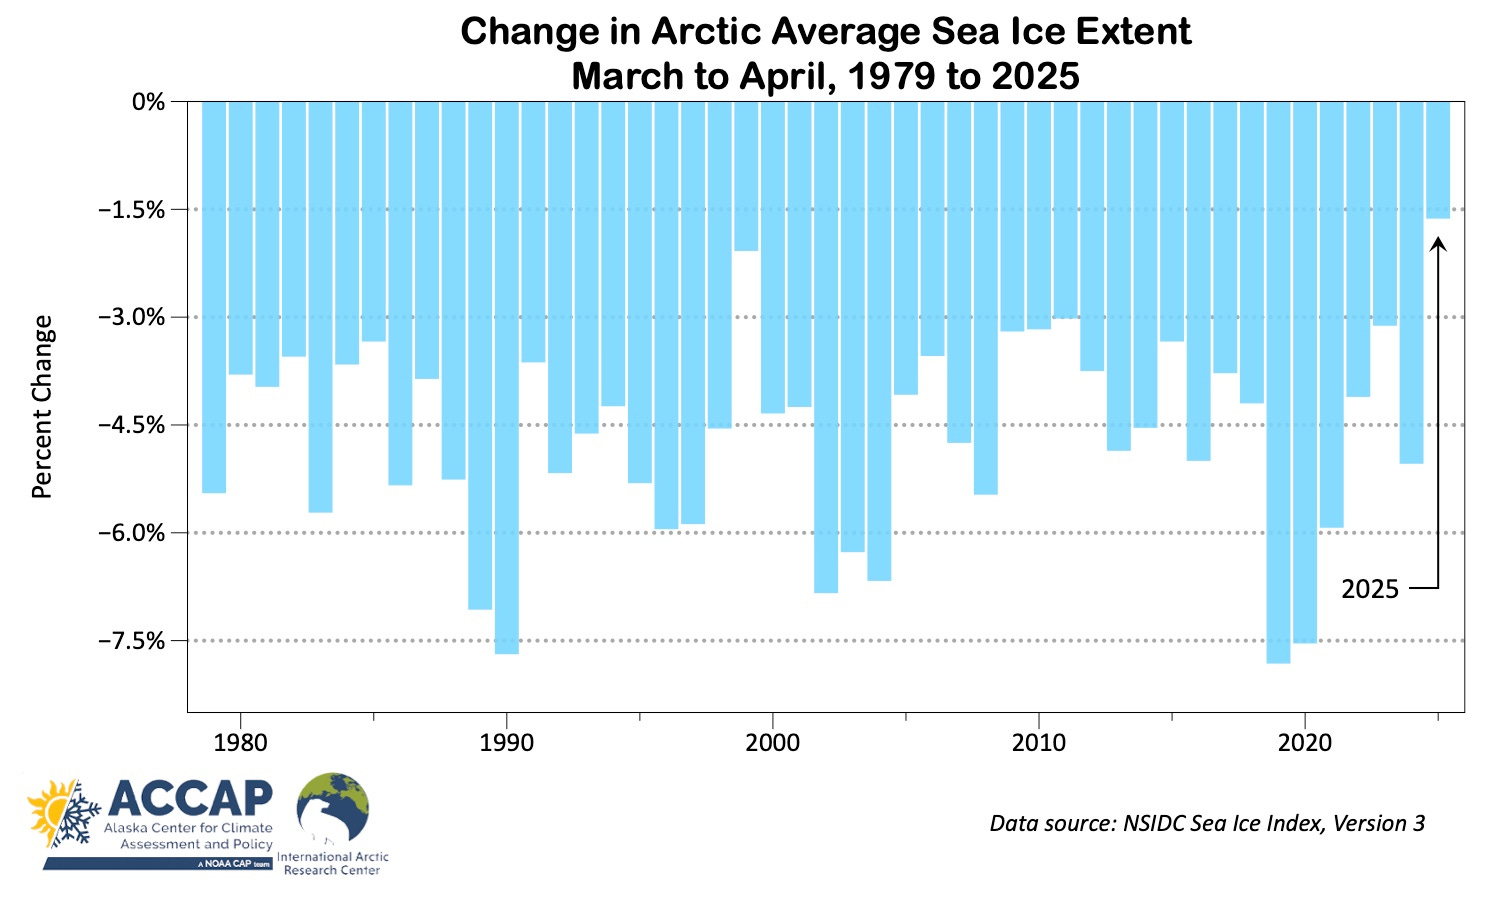
Figure 5 shows the change in the average ice extent between March and April each year 1979 to 2025. Between 1979 and 2024, the median extent decrease between March and April was just over 4.5 percent. This year the decrease was only a third of that and was the lowest March-to-April decrease in the 47 year satellite record. The only other year when the March-to-April decrease was less than 3 percent was 1999.
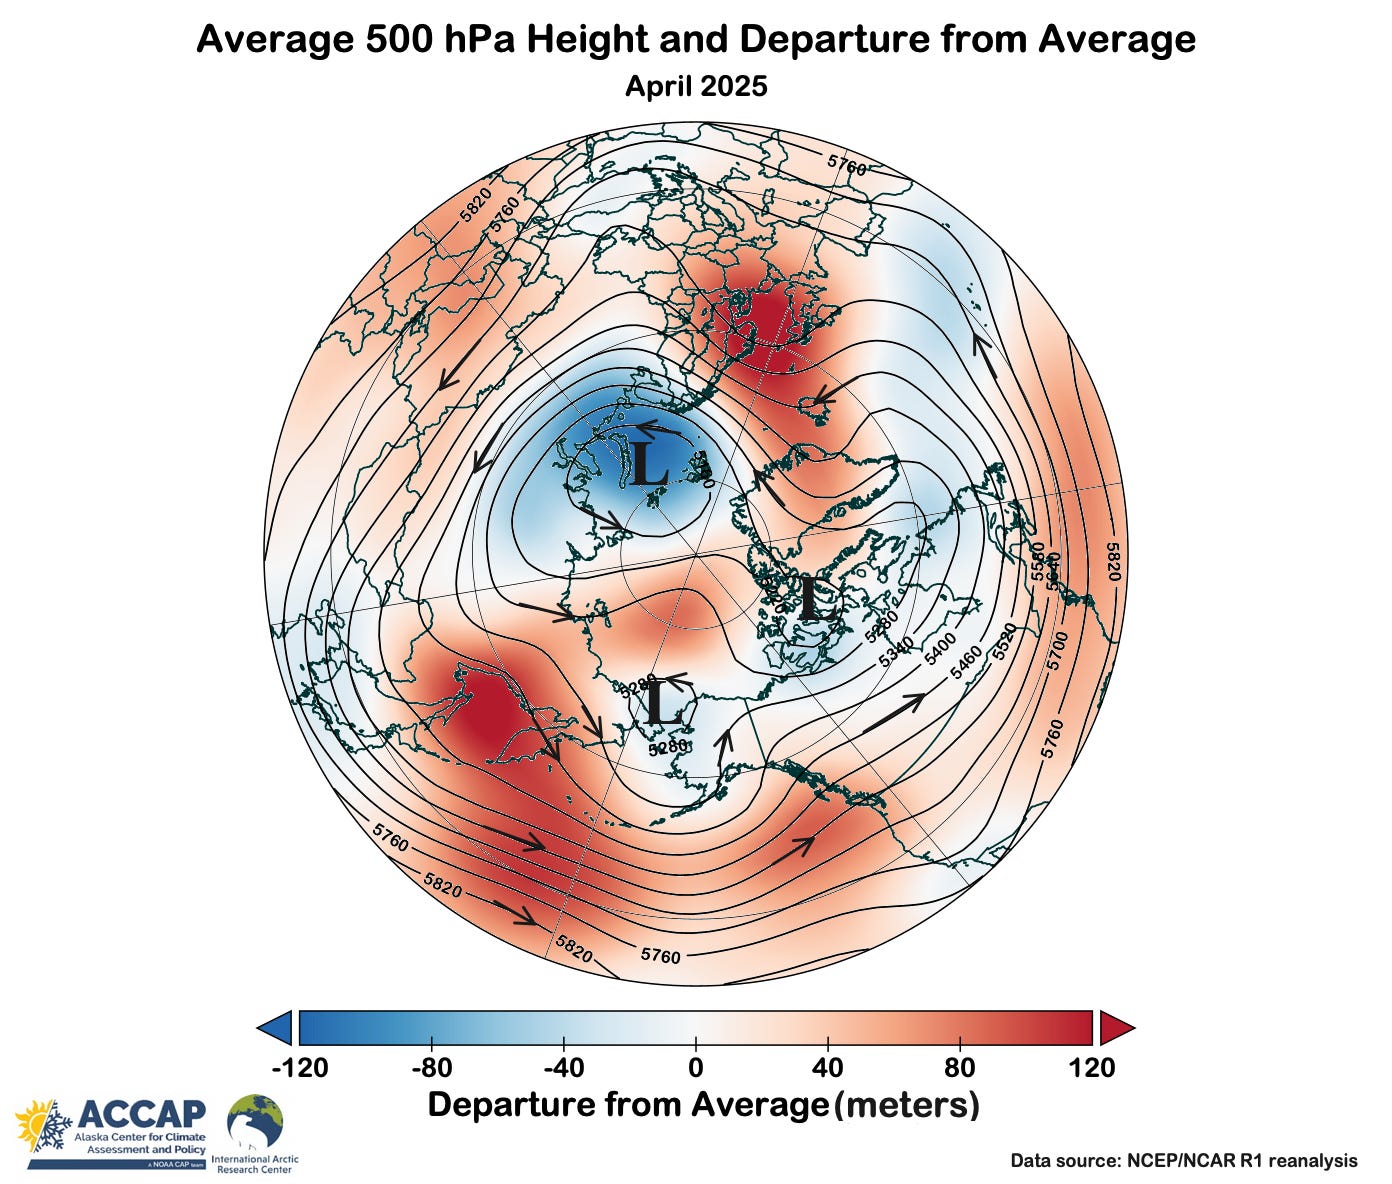
April Weather Pattern
The mid-atmosphere pressure and wind pattern goes a long way to explaining some of the temperature departures and especially the low sea ice loss. In particular, the prevailing cold low aloft east of Svalbard and a similar feature over the southern Chukchi put the brakes on sea ice loss in the Barents and Bering Seas and helped keep surface air temperatures down. Conversely, relatively warm high pressure over the Sea of Okhotsk accelerated ice loss there and supported the very mild surface air temperatures to the north.