


Anchorage's "January Thaw"
Myth or reality?

Many regions in mid-latitude North America have, at least in folklore, a “January thaw”, a period of mild weather that trends to reoccur over the years about the same time of the month. In places where winter temperatures are typically near or even above freezing, a “January thaw” can refer not just to a literal thaw, but “an early taste of spring”. One place in Alaska that shares this tradition is the Anchorage area, where a “January thaw” comes up in conversion. Since Anchorage just came through a week with above freezing temperatures on five of seven days (January 21-27, 2023), let’s dig into using Anchorage International Airport climate observations.
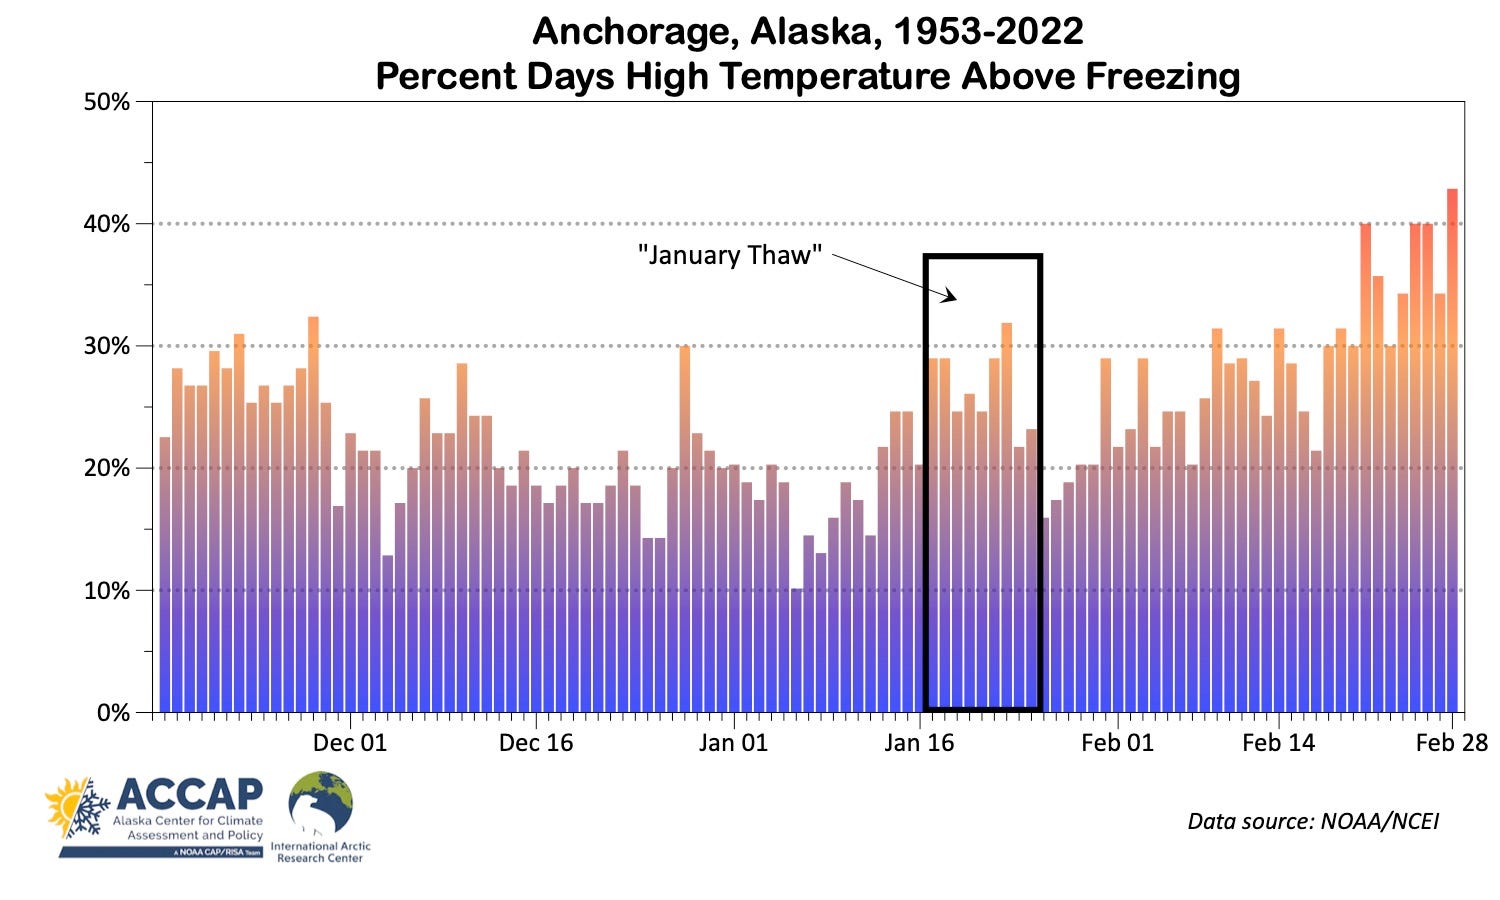
First off, since the average daily high temperature in Anchorage during January is 22 to 24F (-6 to -4C), we’ll look at temperatures above freezing as the basis for “thaw” analyses. Let’s start with a simple plot of the daily frequently of above freezing temperature during the 70 winters 1953 to 2022. Figure 1 shows the percentage of days above freezing each calendar day. Over the last 70 years, January 6th has seen the temperature get above freezing 7 different years, least of any day in the year. In February the increasing solar energy is having a larger influence on daily temperatures, so that more than 40 percent of the time February 28 the high temperature is above freezing. I’ve boxed in the putative time of the “January" thaw”, roughly a few days either side of January 20th, when there is a greater frequency of above freezing temperatures before or immediately afterwards.
At even a casual glance at Fig 1. the “noisy” nature of daily data is obvious: if we had twice as long a period of record (and lived in world without changing climate), the daily peaks and valleys would change. By aggregating days together we can get a clearer look at possible patterns without having to wait until the 2090s. In climate analysis a five-day window is commonly used (in jargon called a “pentad”) for smoothing noisy daily data. We do this in Fig. 2, which more clearly shows the time-varying pattern of “how often does it get above freezing in Anchorage in winter”.
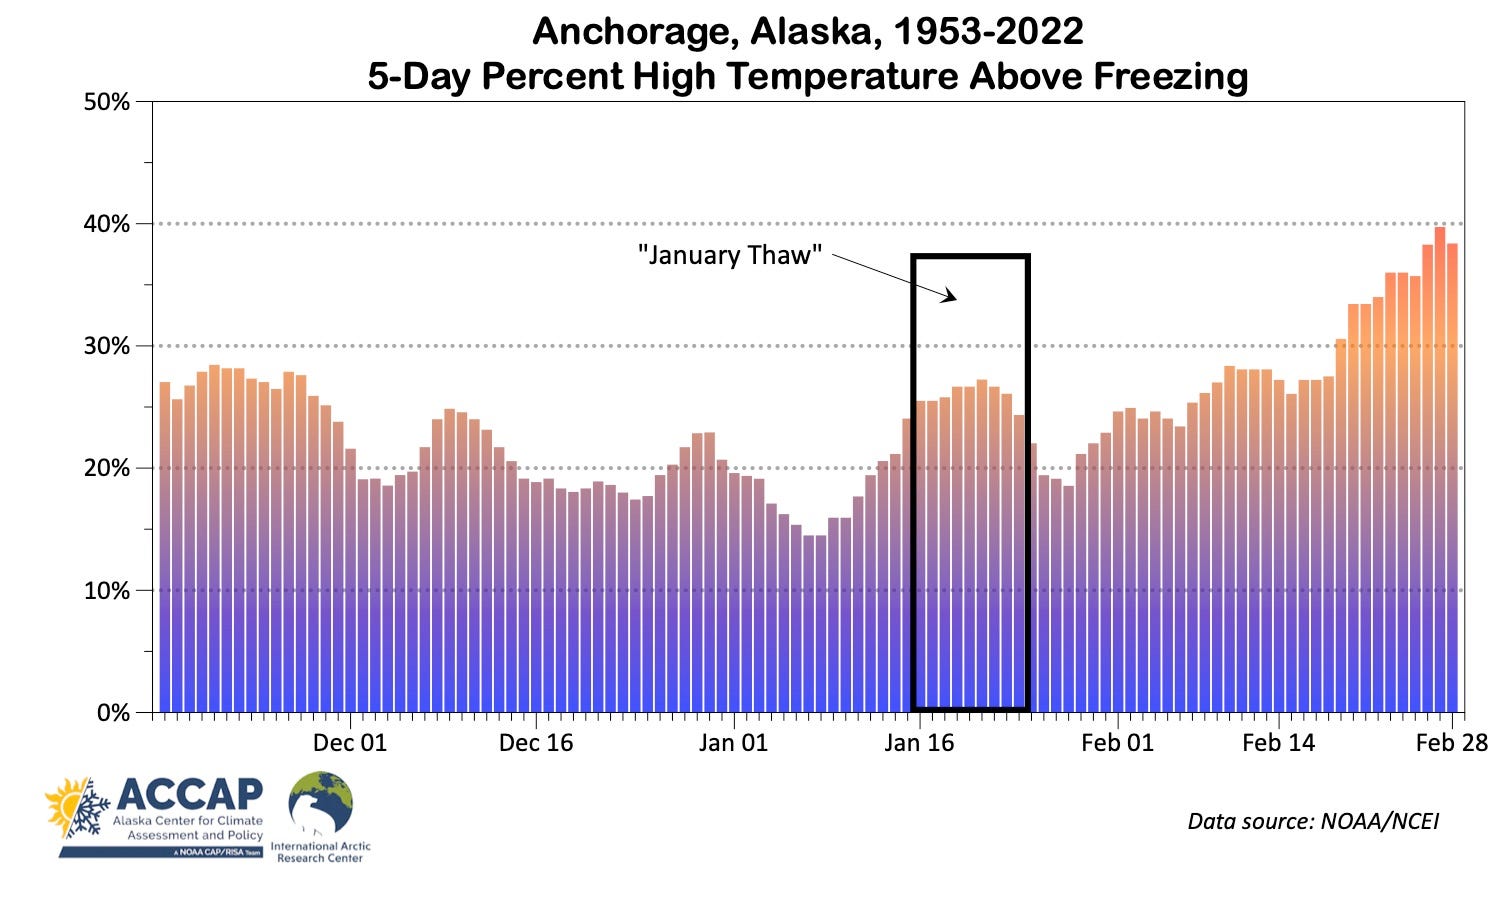
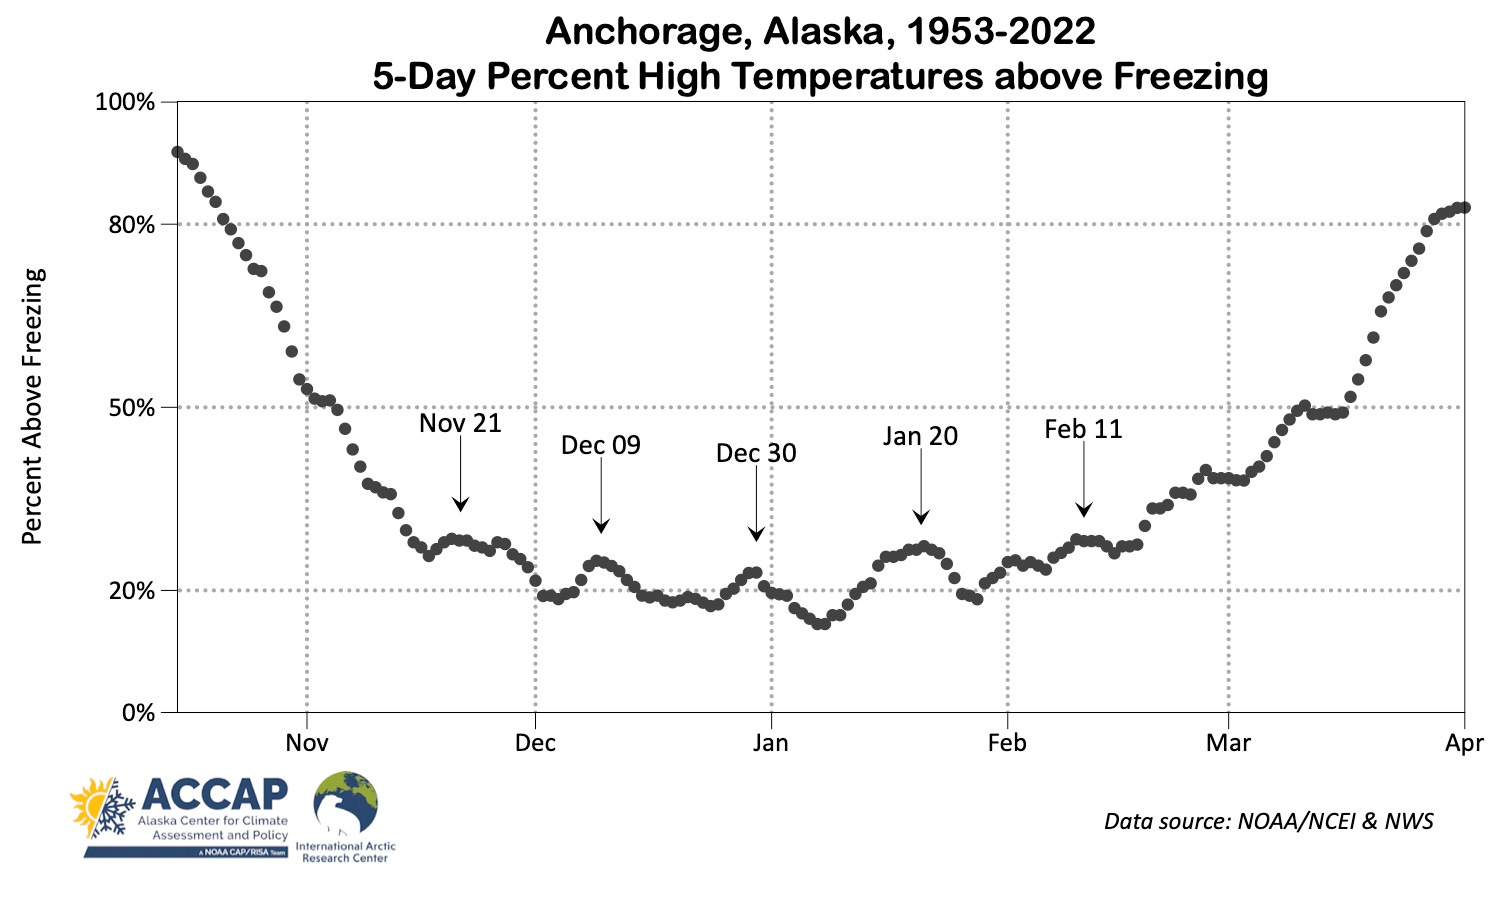
Figure 3 shows the full winter view of above freezing temperature frequency, and I’ve annotated an apparent cyclical pattern in the peaks and valleys of above freezing temperature frequency. At a roughly three week intervals from late November until mid-February there is a small but noticeable (and “statistically significant”) uptick in the frequency of thawing days. The later January “bump” has, very slightly, a higher percentage of above freezing days than any of the other “bumps”. So it this sense the “January thaw” is a real thing in Anchorage: during the third week in January there have been more days with above freezing temperatures than other time between early November and late February.
However, this isn’t quite the end of the story. During the winter, day-to-day weather is highly correlated, which makes a “persistence” temperature forecast (whatever it was yesterday is the forecast for today) a reasonable first guess. So the peaks in Figure 2 and 3 are in part “inflated” by this persistence: a few long-lasting warm spells swell the daily count totals. Another different way to look at this is to ask “how reliable is a thaw”?
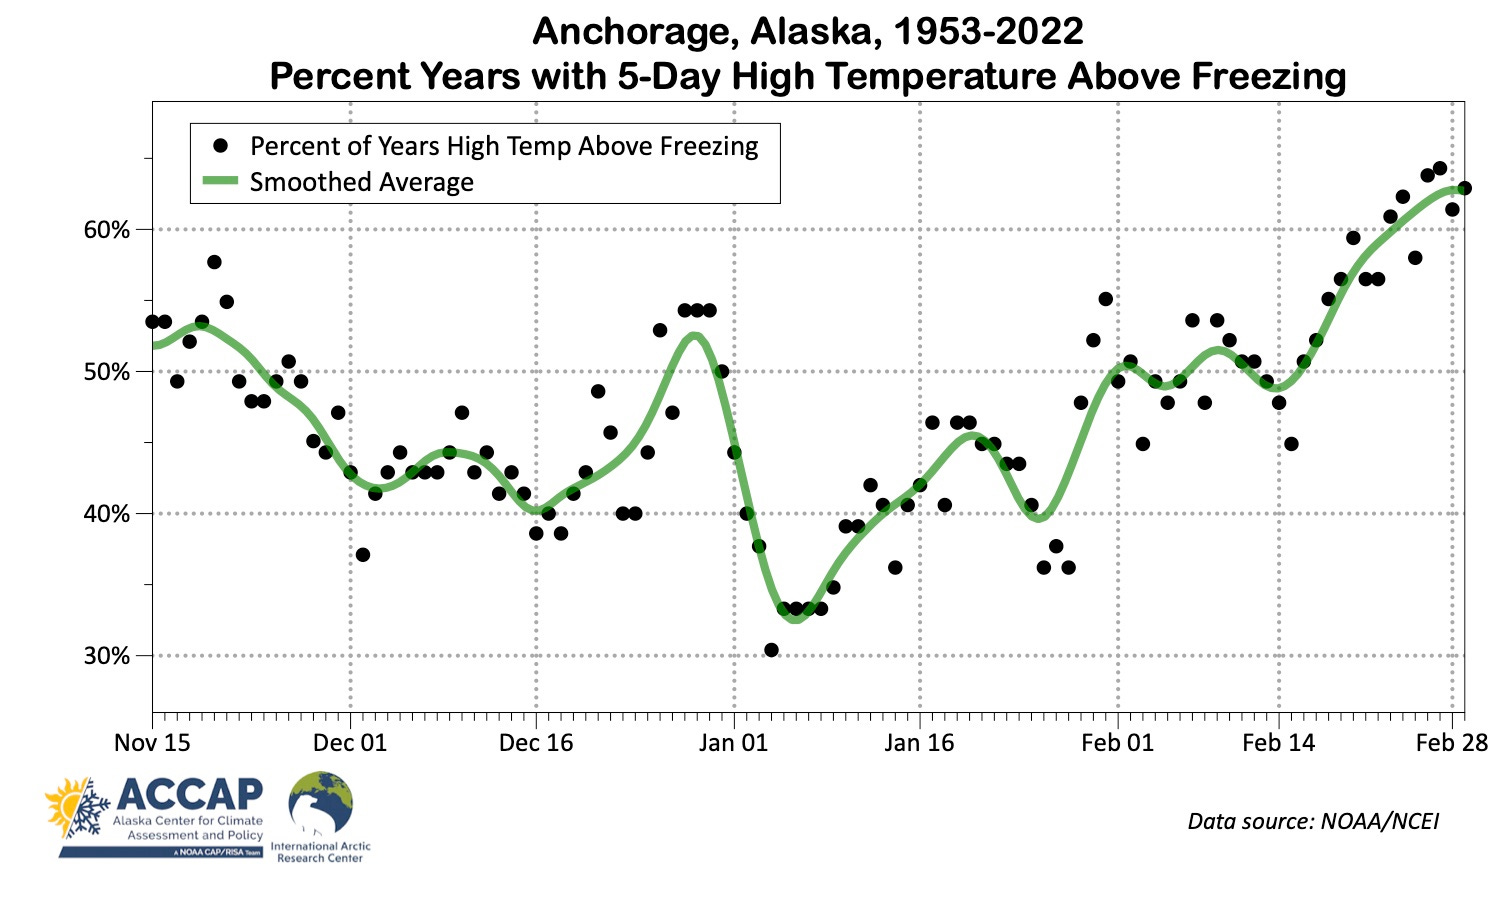
Figure 4 plots the percentage of years 1953-2022 when at least one day in each 5-day block (pentad) had a high temperature above freezing. And this tells a somewhat different story. Here the largest mid-winter peak in having at least one day above freezing is the time between Christmas and New Years: more than half of years have seen at least one day above freezing. In contrast, the “January thaw” centered around January 20, while a dramatic increase from earlier in the month, has happened less than half the time (the very end of January has better odds). So if your relatives want to visit in winter but want some thawing weather, the holidays are the time to come. But at least historically, coming in early January offers the best chance to have it stay below freezing.
Thank you for the thawtful analysis (couldn’t resist)