


Alaska Annual Climate Trends

With December 2022 climate data rolling in, it’s time for the annual update to the climate trend graphics for Alaska and vicinity. I usually present spatial maps of Alaska climate change information over 50 years. I do that mostly because it’s a time range that is within a person’s (of a certain age) adult working memory. Also, it’s a round number and has a nice ring to it: “half century”. For time series, which typically serve a slight different purpose, I’ll use the full range of reliable data.
There are multiple datasets available for analyzing temperature changes in Alaska but fewer options for precipitation and snow.
Reanalysis products provide “best guess” snapshot of ocean-land-atmosphere environmental conditions based on a weather model that incorporates observations of all sorts, but mostly satellite based, and is restarted every few hours. From this “modified weather model output” it’s straightforward to construct climate-style data for days, months or longer (though this requires lots of computing power). This allows for “continuous” climate variable output, or, to paraphrase one reanalysis producer, this provides “maps without gaps”. I rely heavily of the ERA5 reanalysis from the European Centre for Medium-Range Weather Forecasts (ECMWF) because it has the highest spatial resolution (~20 miles/30km) for any operational near-real time reanalysis available, a critical consideration given Alaska’s complex terrain.
NOAA/National Centers for Environmental Information (NCEI) provides monthly gridded temperature and precipitation data as well, using only in-situ observations compared against a static climatology. Because of the significant limitations of using only in-situ observations when there are comparatively few observations in complex terrain, I prefer to use this data in spatially aggregated format, typically the 13 climate divisions for Alaska that NCEI adopted for use in 2015. Brian Brettschneider (@Climatologist49) regularly produces Alaska-specific analysis and trend products directly from the NCEI gridded data. The NCEI monthly precipitation data suffers from severe data quality issues, and the general lack of reliable precipitation observations, especially in the cold season, make it unsuitable for my purposes.
For the longest temperature time series at the Alaska (or larger) scale, we have the NASA GISS and Berkeley Earth datasets available. The December data for these have not yet come online so we don’t have complete 2022 data. When the 2022 data is complete I’ll update this post.
Temperature
Figures 1 and 2 shows annual average temperature changes for the 50 years 1973 through 2022. Figure 1, from ERA5, shows finer detail and is not restricted to land areas of Alaska. In addition to the dramatic increase in average temperature over the western and central North Slope, there are a couple of areas of interest. First, southeast Interior Alaska eastward into the central Yukon Territory shows comparatively little warming, 2F or less, since 1973. The other area that stands out is large warming in portions of southeast Alaska, especially near the British Columbia border.

Figure 2 shows the station-based NCEI 50-year temperature change at at the climate division scale. The pattern is generally similar to the ERA5, though of course lacking in detail. For some purposes this is actually okay: it’s easier for some folks to grasp with big picture, more warming in the north and west than in south and east, than from the “noisy” ERA5. The most obvious difference between the two analyses is in Southeast Alaska, where increases in the NCEI are significantly less than in ERA5. This is partially but not entirely explained by the station availability in the NCEI data.
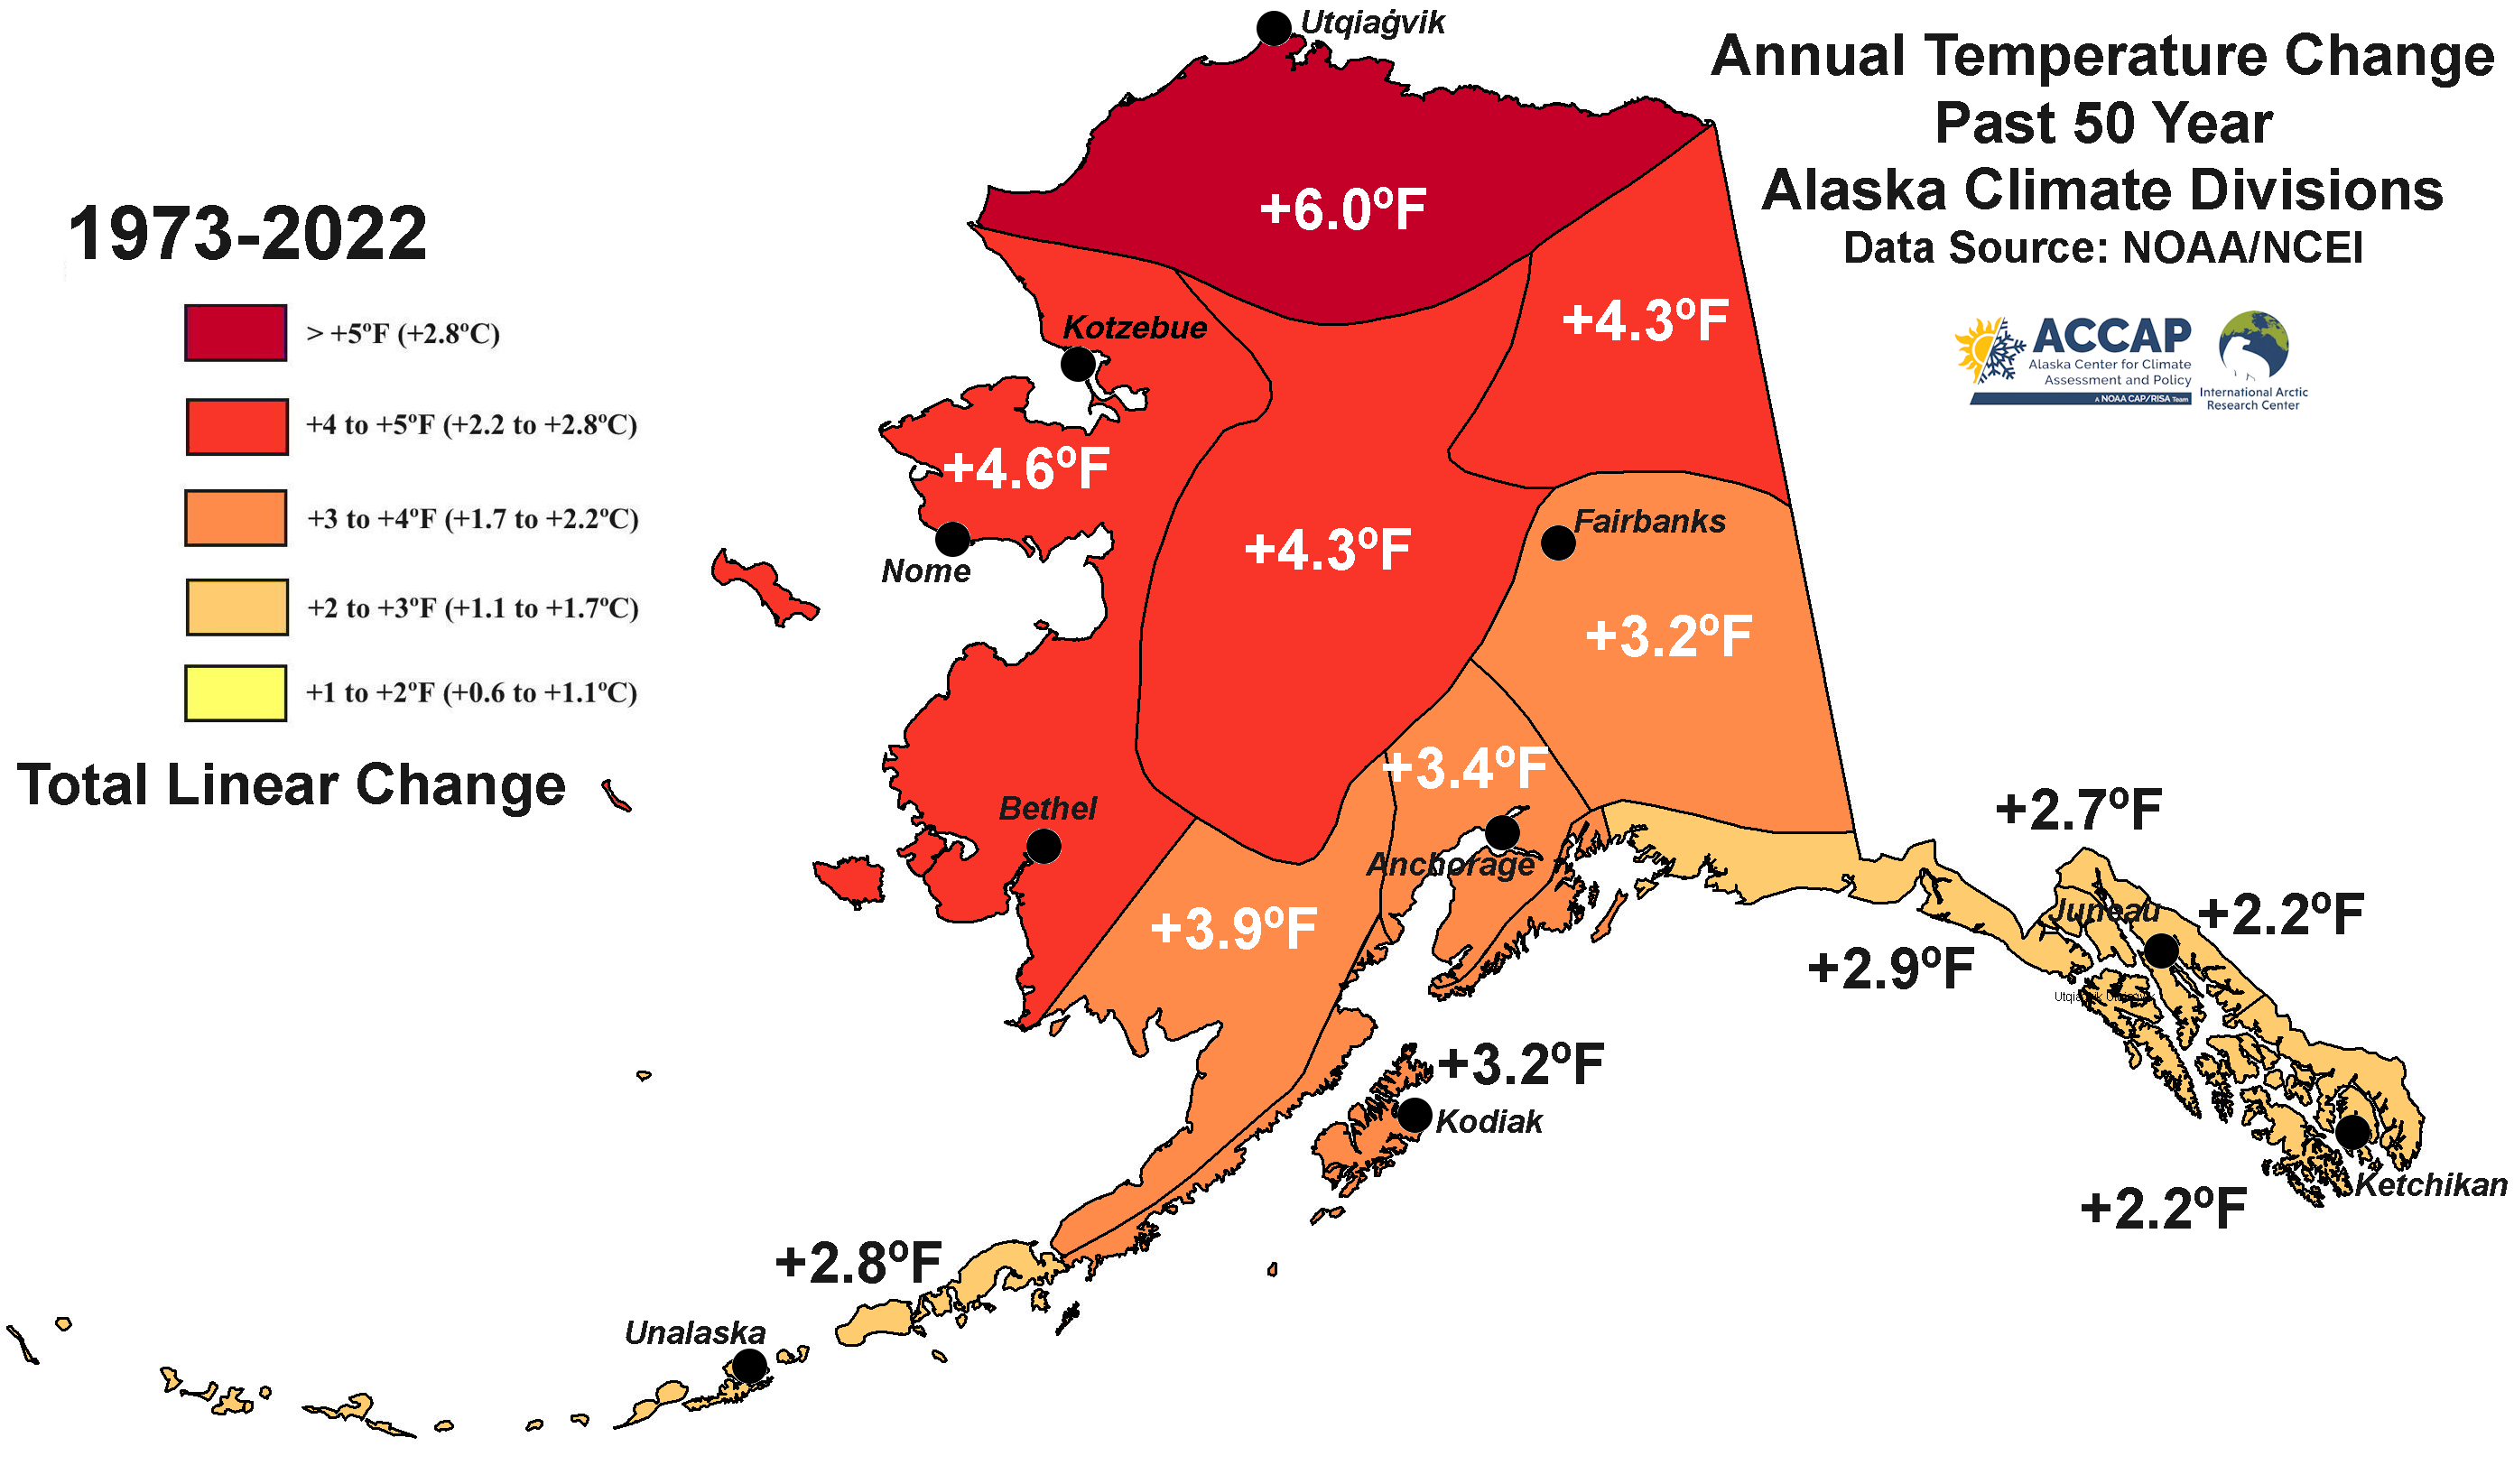
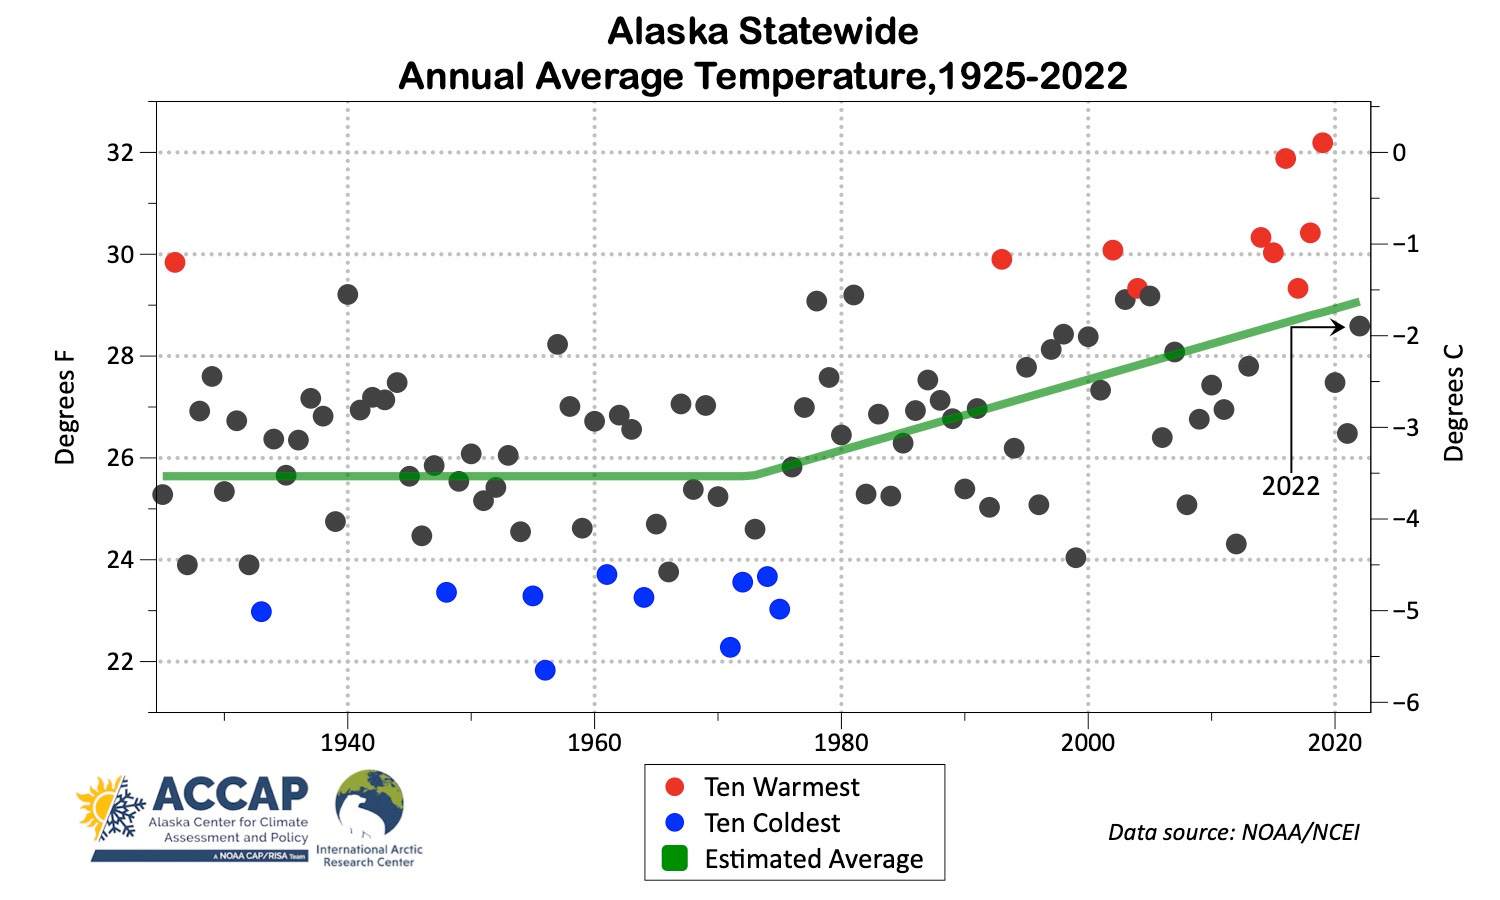
At the Alaska-statewide scale, the time series for the full 98 years of NCEI data is presented in Figure 3. There was no significant trend in the annual average temperature in the first 50 years of the data, but since the mid-1970s the increase in the estimated average temperature has been a dramatic 3.4F (1.9C), with six of the ten warmest years between 2014 and 2019. Note that there hasn’t been a “top ten” coldest year since the 1970s.
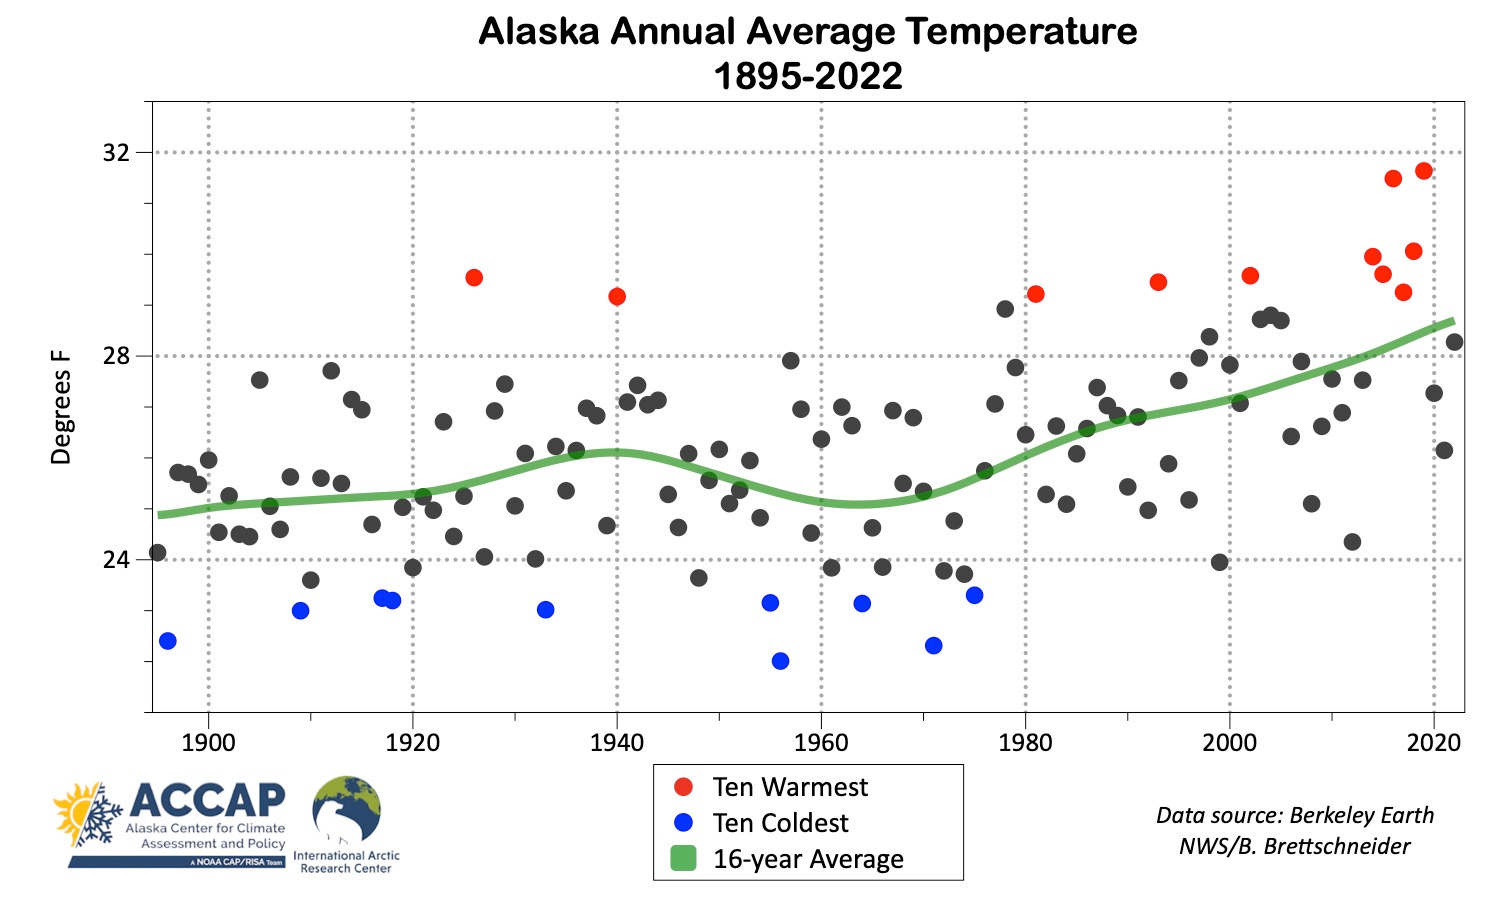
Update Jan 13th:
The Berkeley Earth temperature temperature has posted through December, so here’s the Alaska statewide annual average temperatures since 1895. Of course, it’s the same story.
Precipitation
Over the past 50 years precipitation has trended upward over most of Alaska, though overall it’s a weak trend except on the North Slope. A few areas show a weak decreasing trend but it’s very weak and likely just the result of random variation. Overall, I conclude that Alaska precipitation is increasing, especially across the north and west, but except on the North Slope the trend is more suggestive than robust.

Snowfall
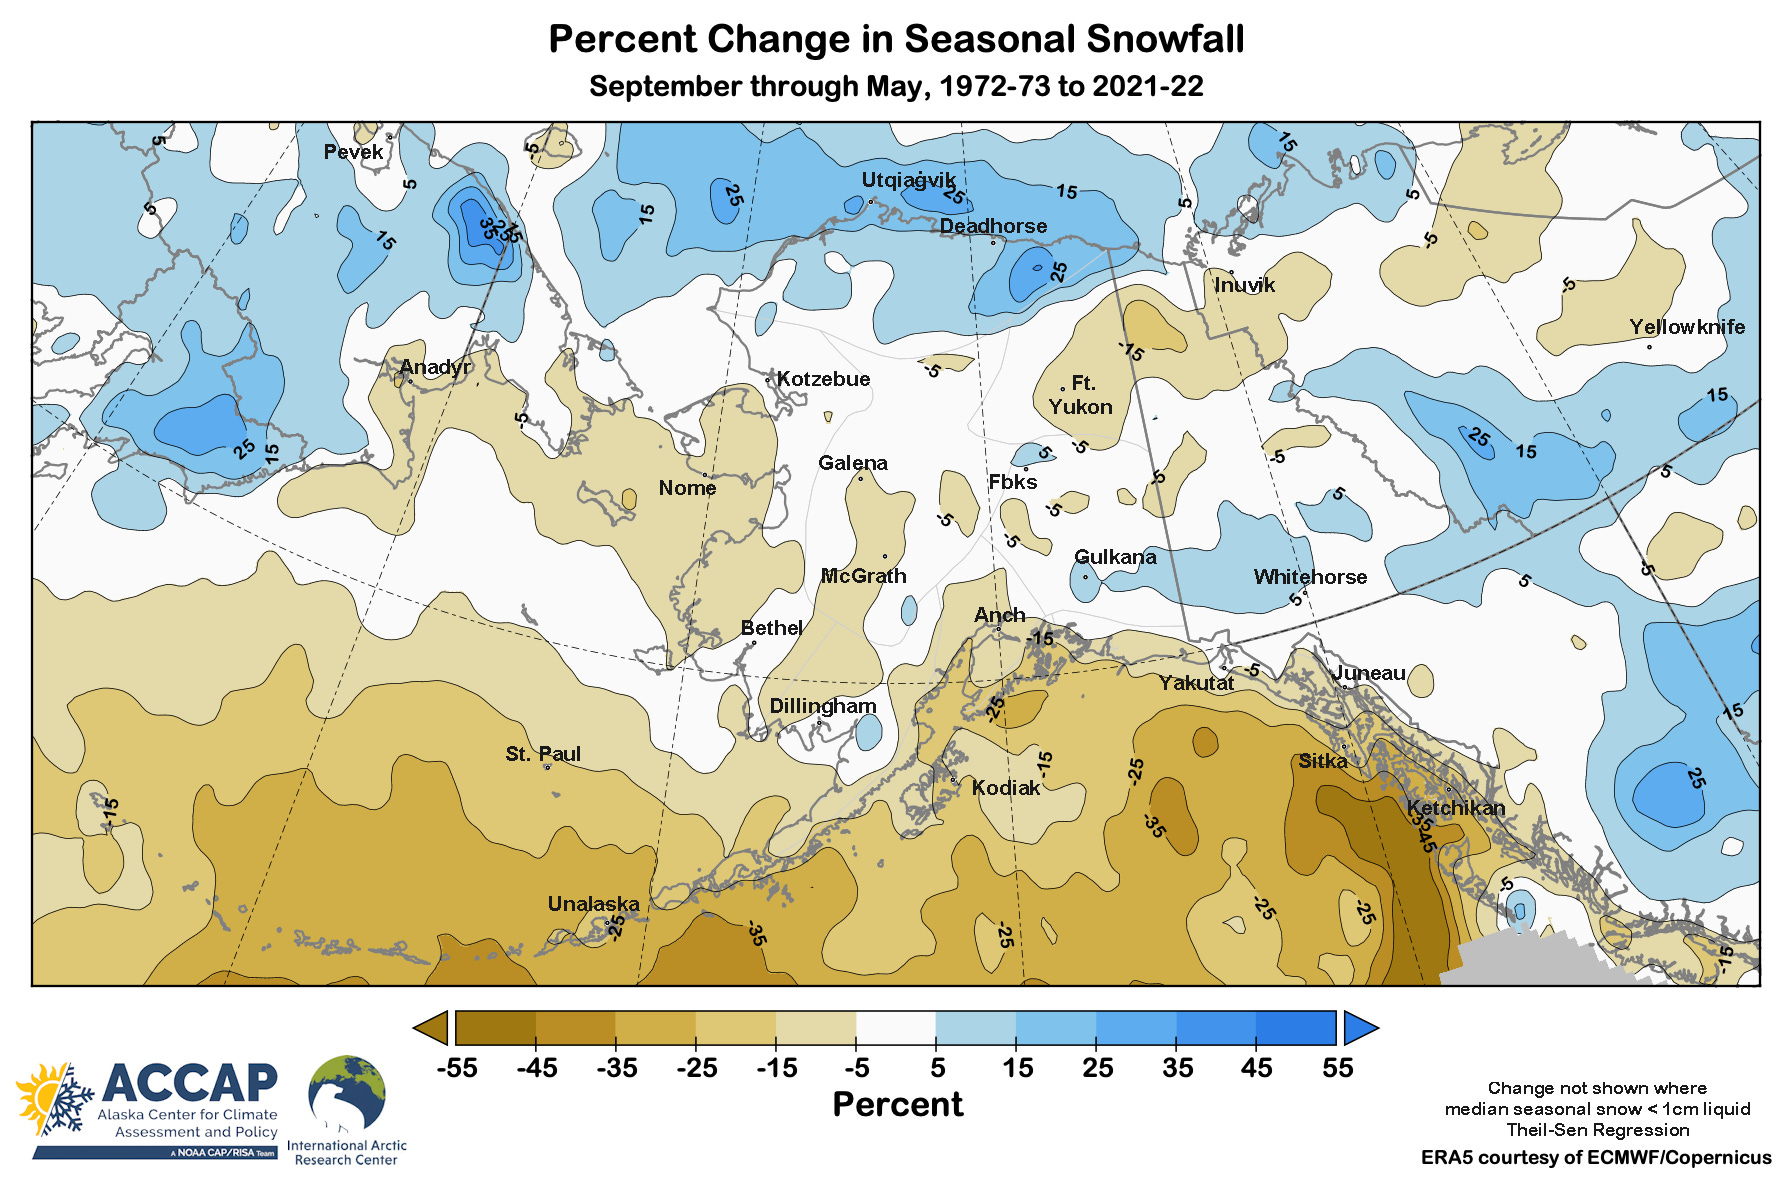
Trends in total seasonal snowfall, like precipitation, are mostly weak over mainland Alaska. The exception for more snow on the North Slope is the result of longer open water periods in the autumn and early winter. The lower Alaska Peninsula and Aleutian Islands show strong trends toward less snow, as does much of Southeast. This is entirely the result of more winter precipitation falling as rain instead of snow. However, in Southeast, it you look closely, you’ll notice that there is a distinct inland to outer coast (so roughly east to west) gradient in the change, rather than a north-south trend. This is because the inner channel areas are closer to the colder continental air that is often lurking over western British Columbia, while outer coast areas are more consistently “feeling the effect” of the warming Gulf of Alaska ocean surface temperatures.
Wow! Incredible, though not in a good way. Thanks for doing this important work