


A wet April in Alaska
Uncharacteristically high Spring precipitation

March and April are collectively the “dry season” for much of Alaska. Average precipitation north and west of the Alaska Range during these two months accounts for less than 10 percent of the annual total (compared to 25 percent or more in July and August). But not always.
April 2025 precipitation
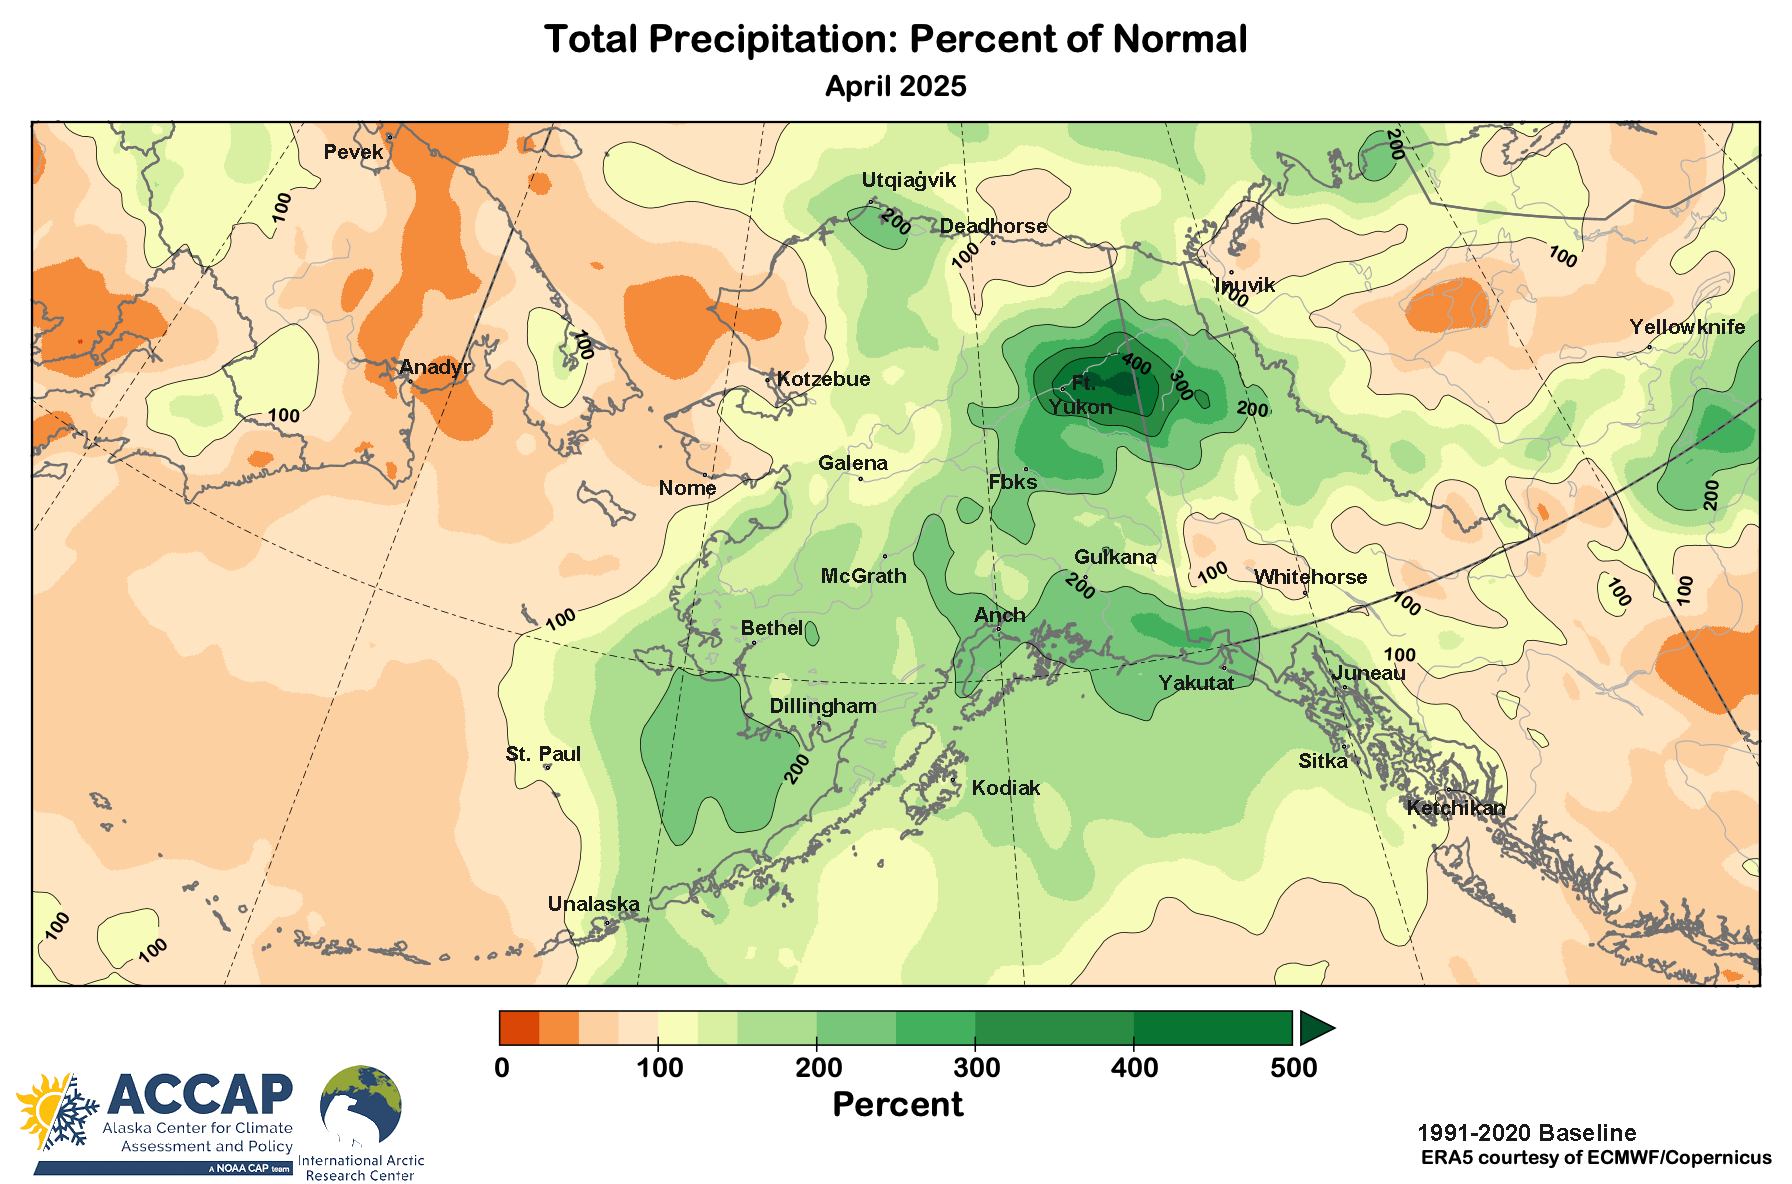
This year, April precipitation was unusually high over much of Alaska: depending on analysis, this was either the wettest April on record (ERA5) or second wettest (NOAA/National Centers for Environmental Information, NCEI). Absolute precipitation totals were not especially high except along the Gulf of Alaska coast, but because April typically has very low precipitation, even comparatively modest totals may approach record levels for this time of year. Figure 1 shows independent estimates of the monthly precipitation from the ERA5 reanalysis (1a) and the NWS Alaska-Pacific River Forecast Center (APRFC) (1b).


There are clear differences in two estimates, not just in the absolute amounts but in the pattern. This is especially notable in the northern Interior and in the Yukon delta. Some of the difference is the spatial resolution. More significantly, the APRFC analysis is based to a considerable extent on automated weather stations, many of which either don’t report precipitation at all or are not reliable with snow, which was the predominant form of April low elevation precipitation north of Alaska range.
April precipitation relative to normal
Most of the available percent of normal precipitation site-specific observations for April are plotted in Fig. 2. While many places had a “top five” wettest April, including Anchorage, Cordova and Yakutat, King Salmon (upper Bristol Bay), was the only long term climate site to report a record total: 3.17 inches (80.5mm) exceeded the previous highest April precipitation of 2.99 inches (75.9mm) in 1963. However, in a mark of how dry April usually is, that’s still lower than the normal precipitation in August and September.
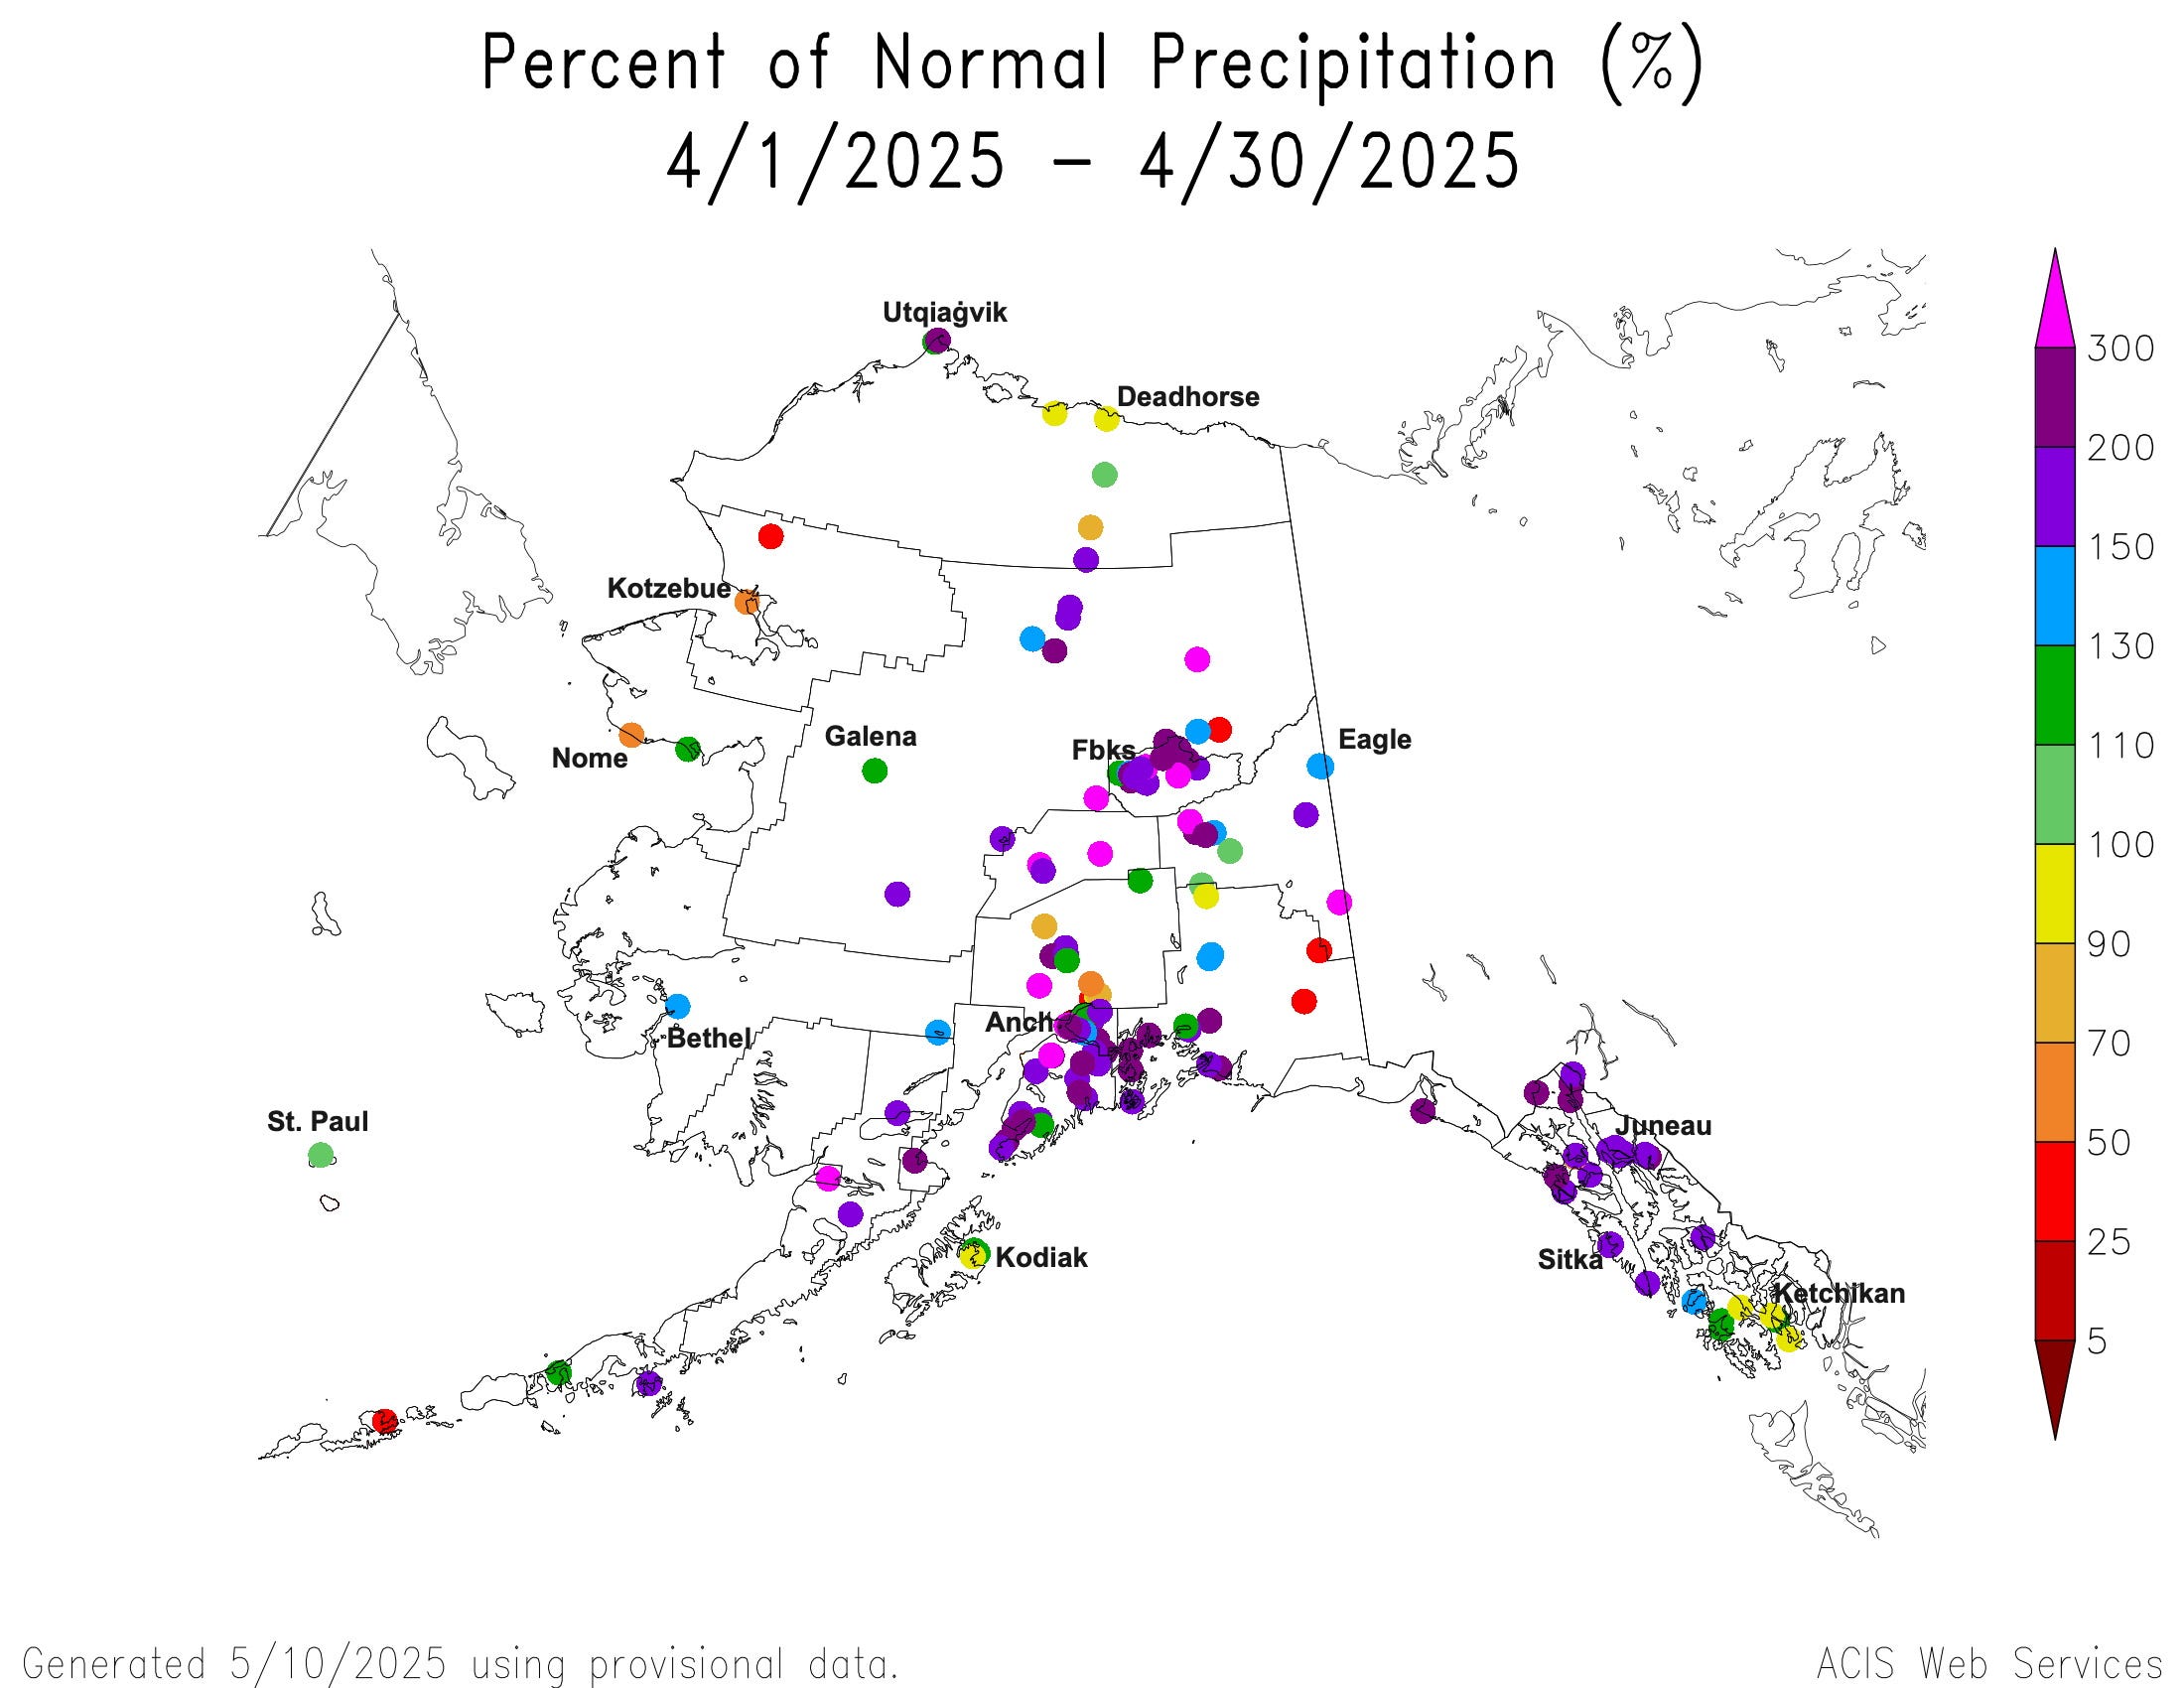
Figure 3 shows the ERA5-based April precipitation as a percent of the 1991-2020 baseline average. Precipitation was above the 1991-2020 baseline average over 88 percent of the state, and about 20 percent of the state had twice or more normal. In this analysis, about seven percent of the state had the highest April precipitation since 1950, principally in the northeast Interior but also some areas on the Gulf of Alaska coast from Prince William Sound to southeast of Yakutat.
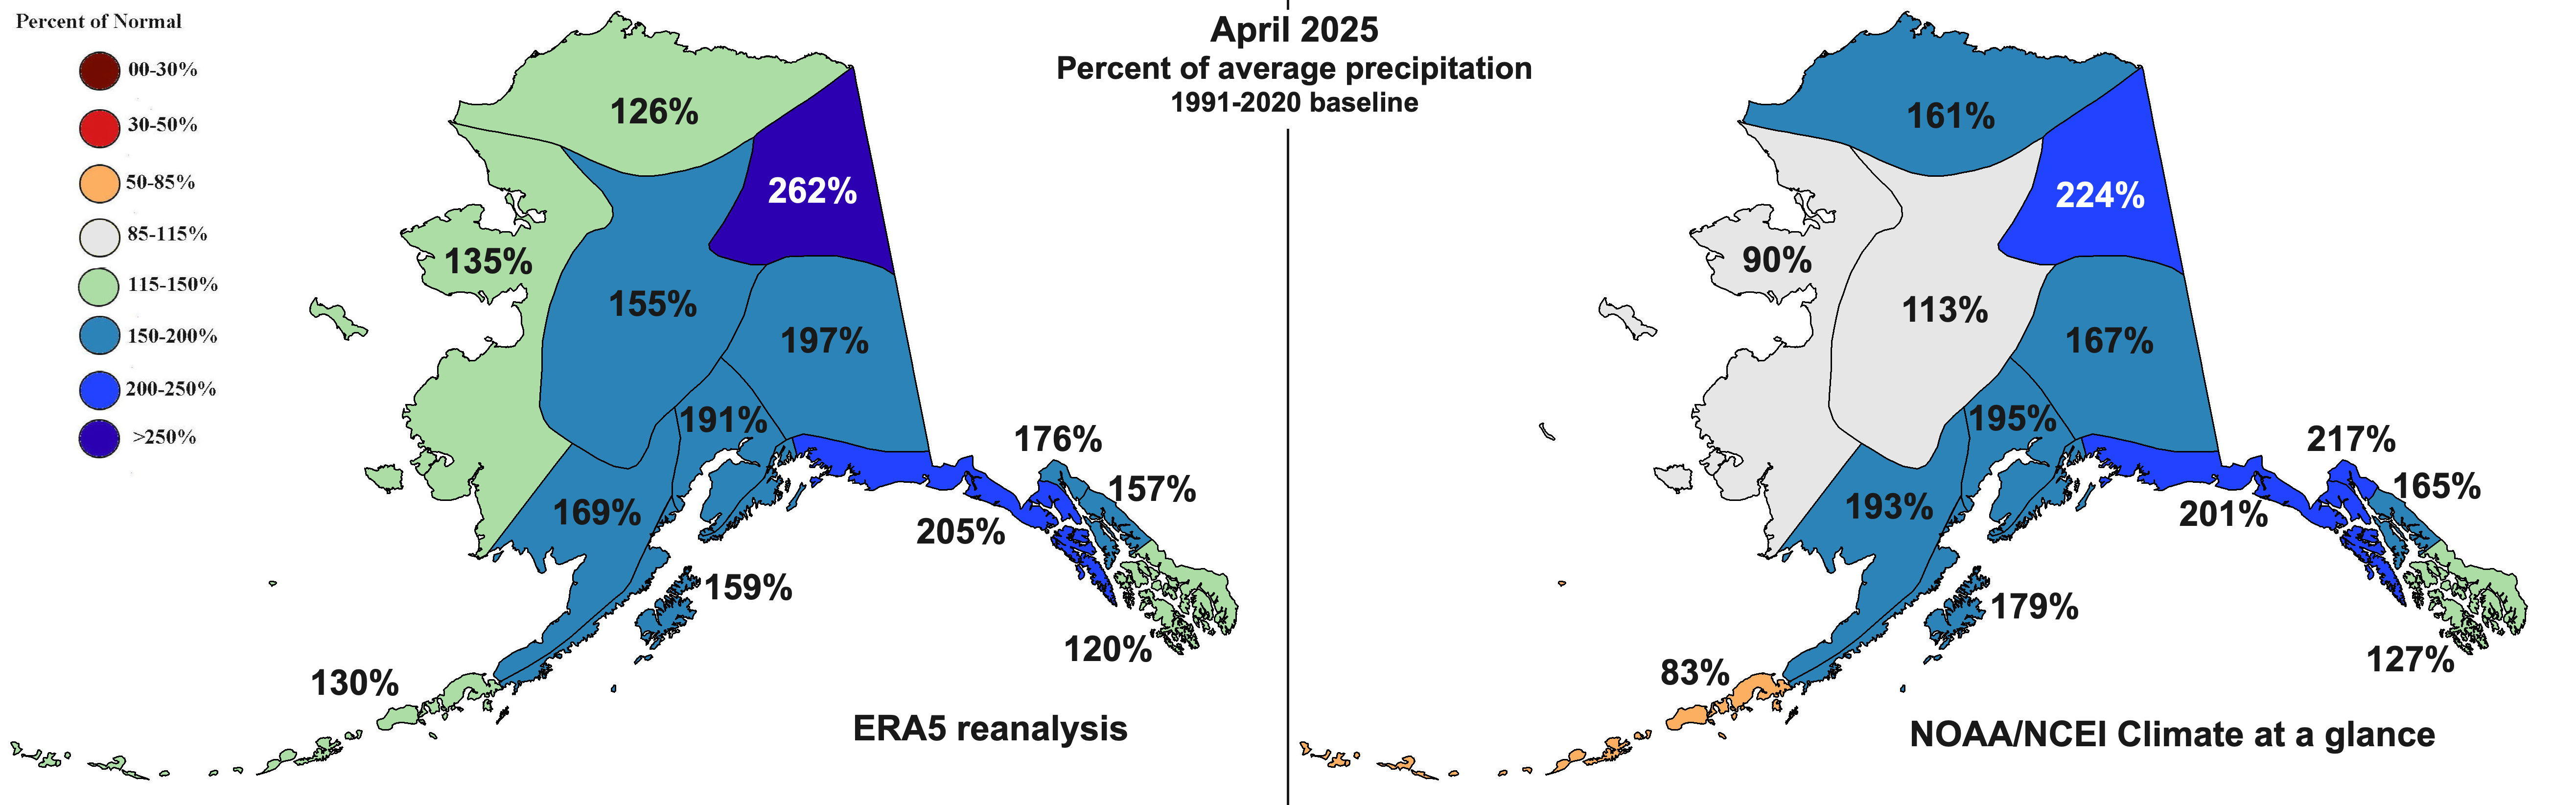
A third source of monthly precipitation analysis is the NOAA/NCEI observation based analysis. This differs from the APRFC analysis in that it includes cooperative stations and fewer automated stations. Figure 4 shows the April precipitation percent of 1991-2020 average for the 13 Alaska climate divisions based on ERA5 (left) and NCEI (right). The NCEI analysis is much different than ERA5 across the large and/or data-poor divisions, but closer in the better observed Cook Inlet and Gulf of Alaska divisions. It’s likely that the difference in precipitation estimates for the West Coast and Central and Northeast Interior divisions accounts for the difference in relative ranking.
Why so wet?
The mid-atmosphere pattern during April explains much of the observed precipitation pattern. On average, low pressure centered over the southern Chukchi Sea and higher pressure centered in the eastern Pacific, west of Haida Gwaii and Vancouver Island, directed storms from the north Pacific toward the northeast Gulf of Alaska coast.
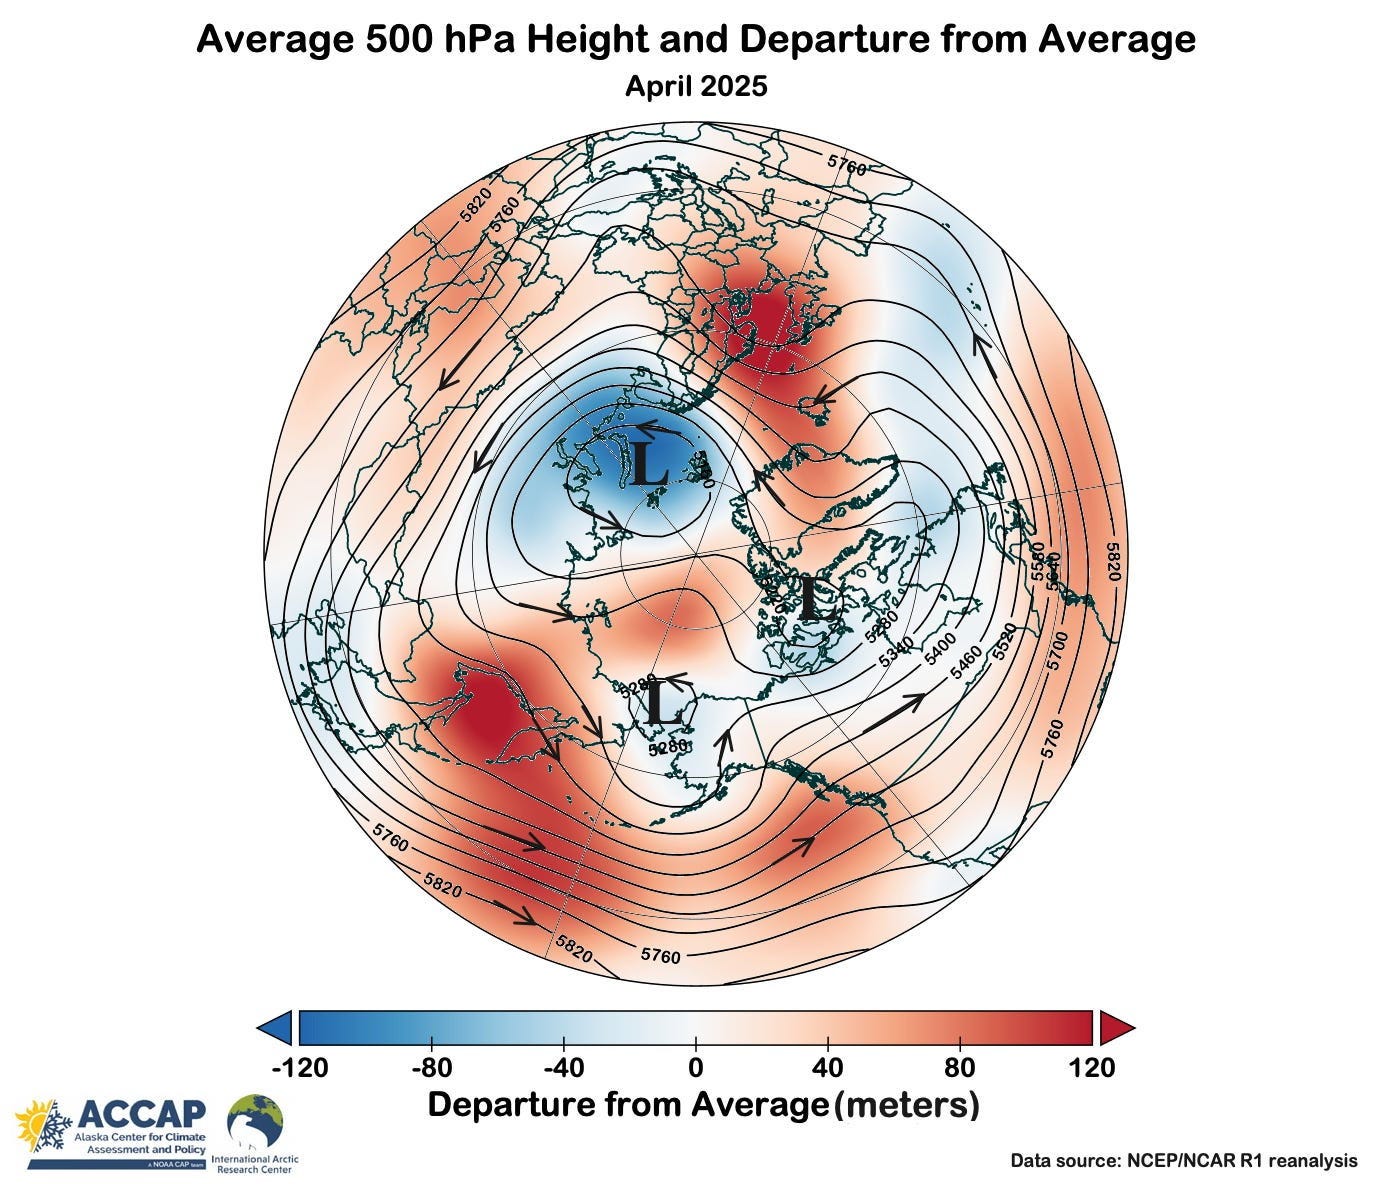
As always happens in this pattern, much of the moisture is wrung out by the coastal mountains, but inland, April average precipitation is low enough that even a couple of storms moving through can bring enough precipitation to boast totals well above the typical April total.
Nothing too unusual then. Reassuring. Have you noticed the loss of any data sets recently? There was something about that in the news I think