2023 North American High Latitude Wildfire
A High Impact Season

With the autumn equinox approaching the North America high latitude wildfire season is about done. Some fires are not extinguished and flare-ups are likely, especially in the Northwest Territories, until the winter snow pack is established. For Alaska, Yukon Territory and Northwest Territories (NWT) combined, the total area burned this summer was about 4.38 million hectares (10.82 million acres), more than 90 percent of that total in the NWT. This was the second highest total in the past 36 years. The only higher year was 2004, when 5.10 million hectares (12.61 million acres) burned, predominantly in Alaska and the Yukon Territory.
Canada
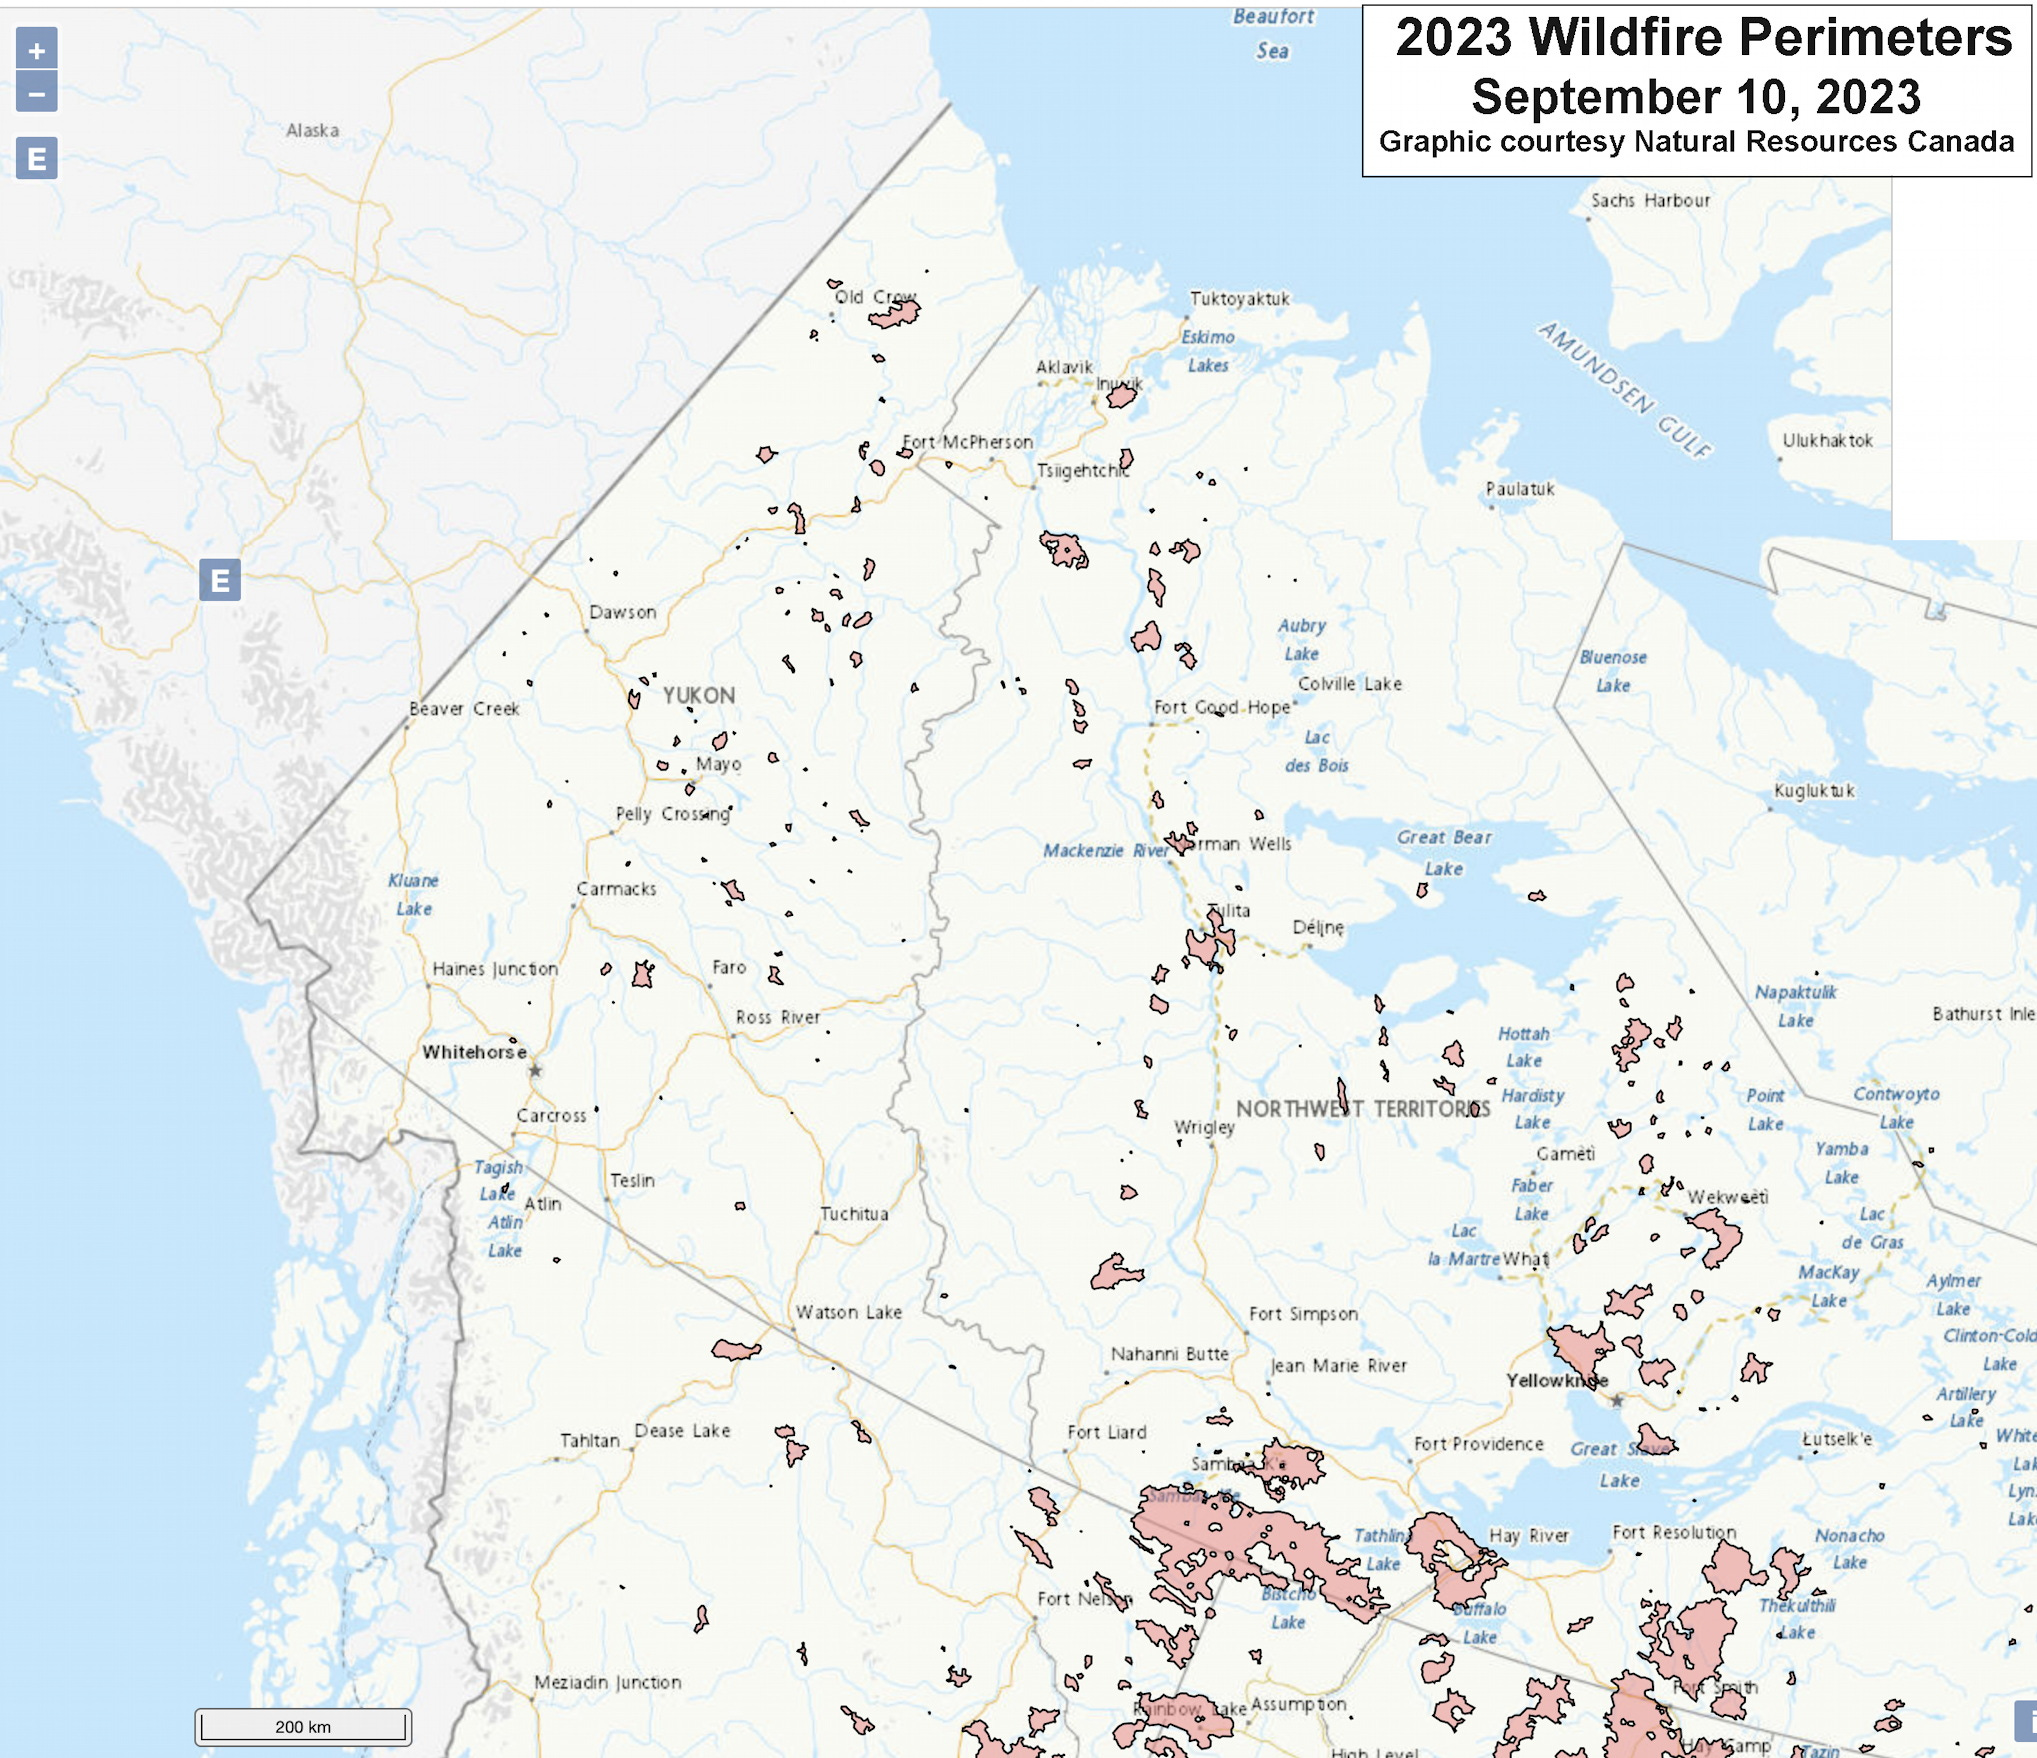
Early snow melt and warm spring helped jump start wildfire season in the NWT, and weather favorable for wildfire continued into July in the lower (northern) Mackenzie River valley and through August in the Great Slave Lake region. In early and mid-August, many communities around Great Slave Lake were forced to evacuate due to the threat of fire, including more than 20,000 people from Yellowknife. At least one community, Enterprise (near Hay River), was largely destroyed by a fast moving fire on August 13-14. As of mid-September, NWT Environment and Natural Resources reported about 4.04 million ha (9.97 million acres) had burned. For comparison, that’s more than half the area of Nova Scotia and about one and a half times the area of Maryland. For NWT, this is more than 12 times the 1991-2020 median and 17 percent more than the previous highest seasonal total of 3.42 million ha (8.44 million acres) in 2014.
In the Yukon Territory, timing of the wildfire season was a bit delayed from normal. Much of the wildfire occurred in central and northern areas during July and early August: the seasonal total area burned of about 224,000 ha (553,000 acres) was the highest since 2019 and more than twice the 1991-2020 median. Wildfire was close enough and smoke dense enough warrant the evacuation of Old Crow on August 9, and there were also a several road closures necessitated due to fires.
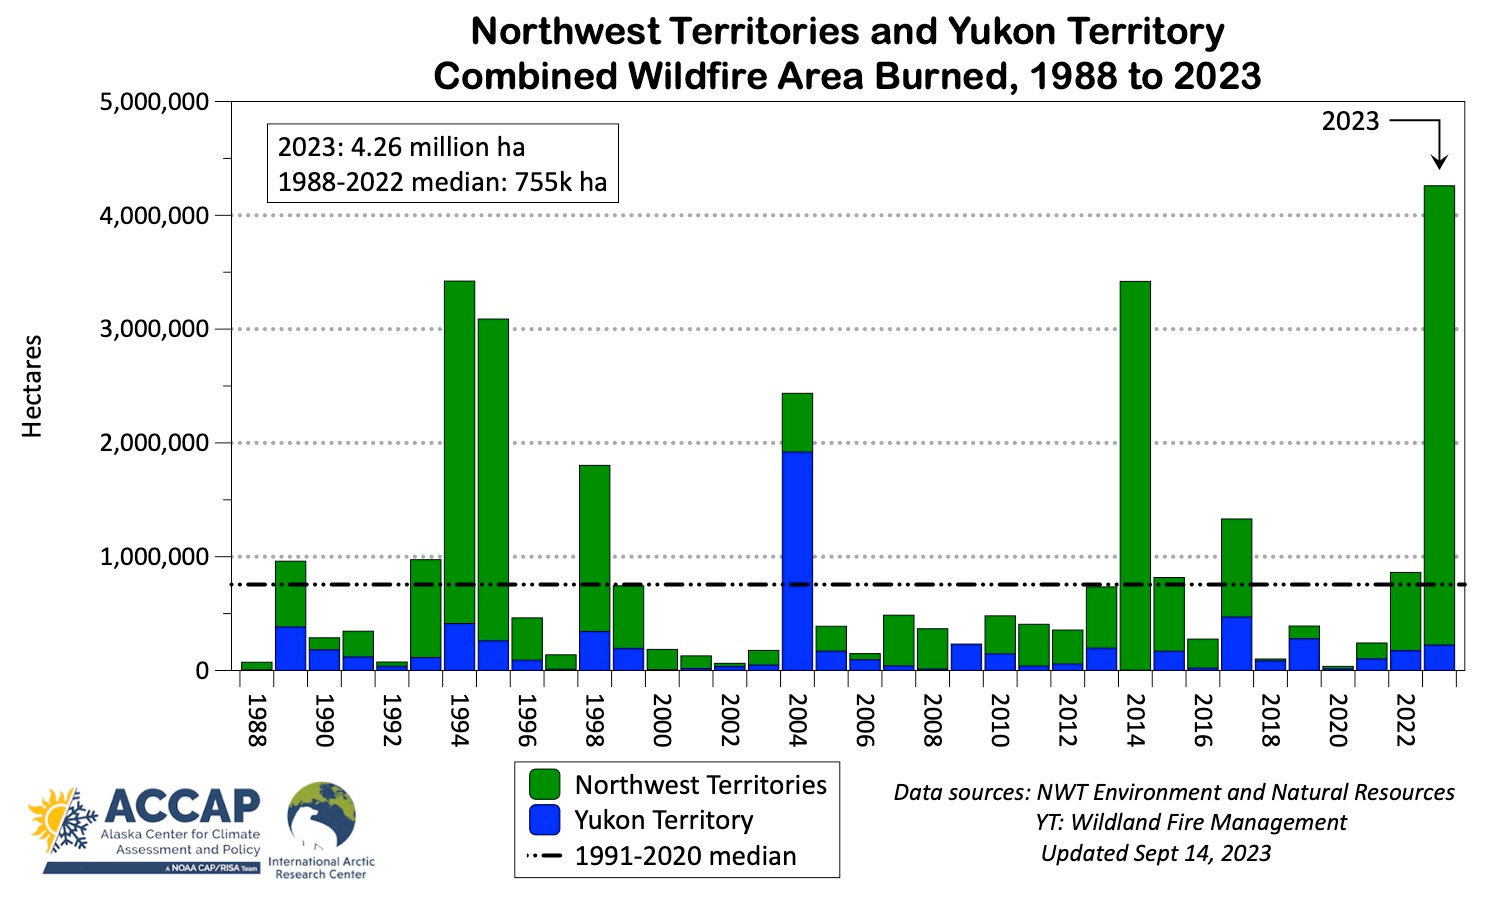
The combined NWT and Yukon area burned each season since 1988 is shown in fig. 2, and 2023 area burned is significantly greater than any season in the previous 35 years. Because the NWT has more than 2.5 times the land area of the Yukon, the seasonal wildfire area burned totals are ordinarily dominated by what happens in the NWT: 2004, the largest wildfire year on record for the Yukon, is a significant exception.
As always with boreal wildfires, because of the total amount of biomass burned, which includes not only trees and surface plants but the near surface duff layer composed of years of undecayed plant material, smoke is a major impact of these fires and of course travels long distances, with many communities having many days with dense wildfire smoke. For example, Yellowknife airport has reported at least 49 days (and still counting) this season with visibility restricting wildfire smoke.
Alaska
Alaska saw unprecedentedly low wildfire activity through mid-July, with the Alaska Interagency Coordination Center reporting only 1892 acres burned for the season on the morning of July 24. That’s less than one percent of the 1993-2022 median total to that point in the season. This was the result of the late snow melt in the Spring, making for a slow start to the season, and then a distinct lack of thunderstorm activity during the early and mid-summer. However, that changed dramatically with a massive thunderstorm outbreak on July 24 that produced the most lightning strikes in and near Alaska in a single day since July 2019 (more details in my post here). This and several subsequent high lightning days wound up sparking dozens of fires, most of them in the central Interior (perimeters plotted in fig. 3), where rainfall following snow melt had been well below normal. While the seasonal total area burned was unexceptionally low, we have no suggestion of any previous summer where effectively all of the seasonal total burned this late in the summer.
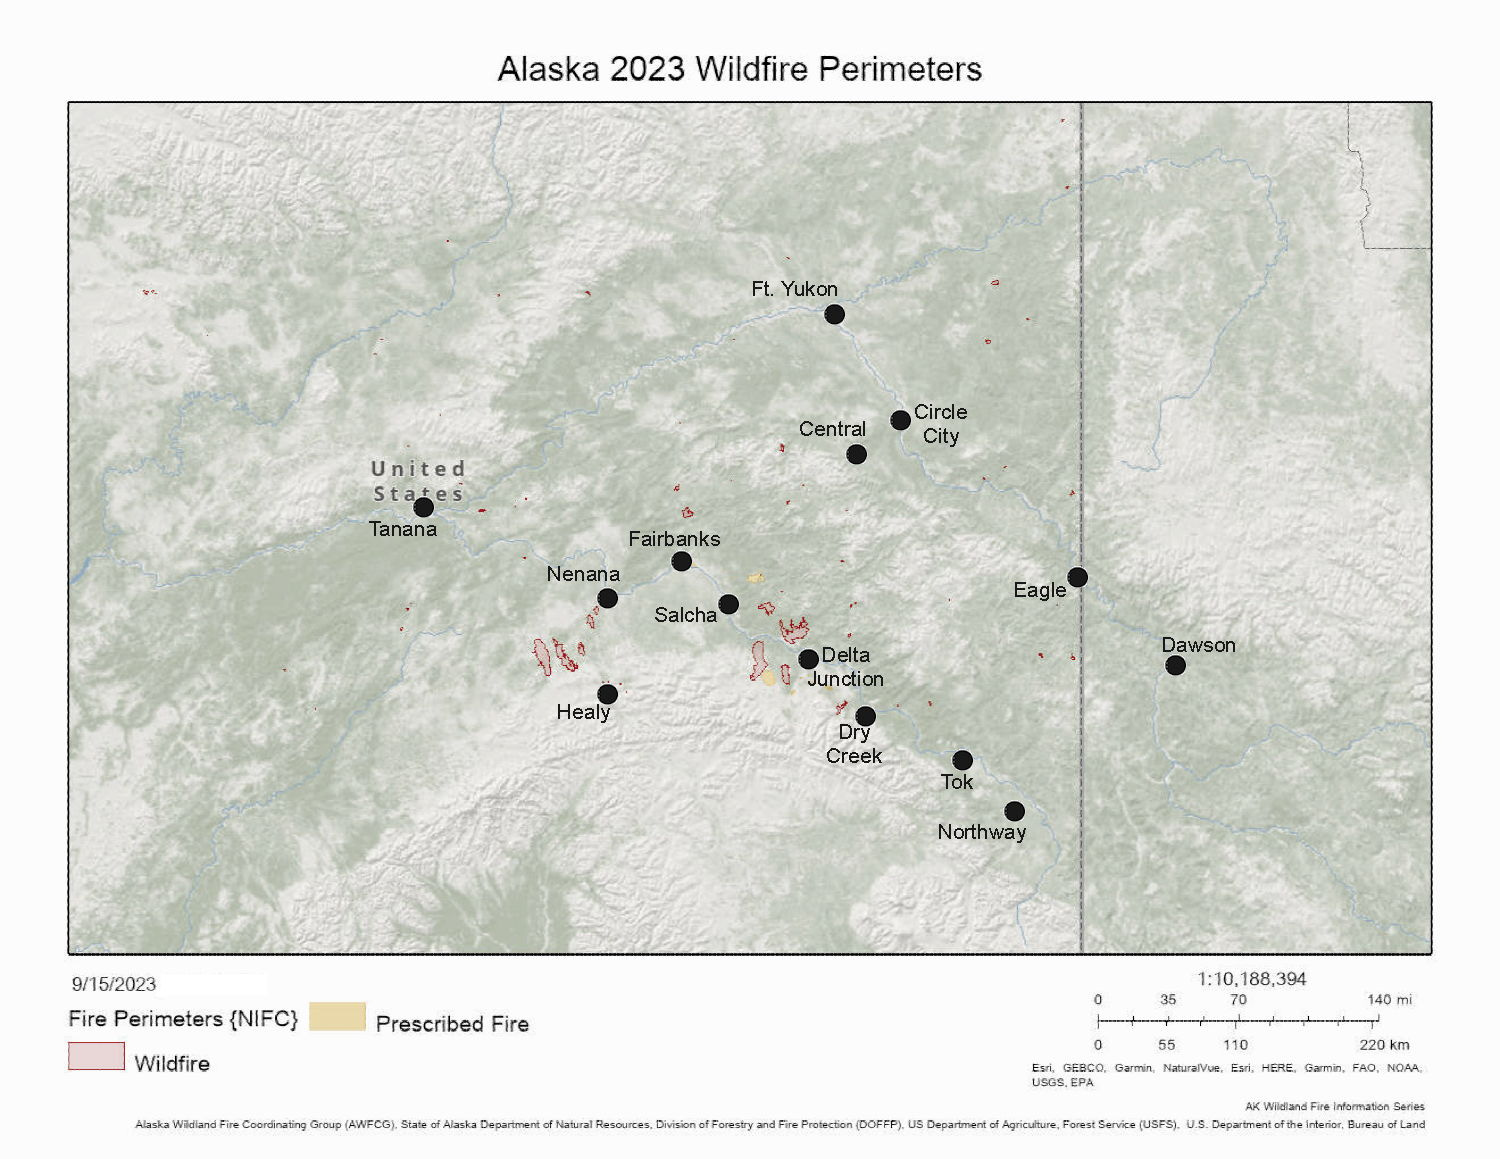
Overall, about 296,000 acres burned in Alaska, which is less than half of the 1991-2020 median. Figure 4 is an update of the seasonal wildfire acreage graphic for Alaska.
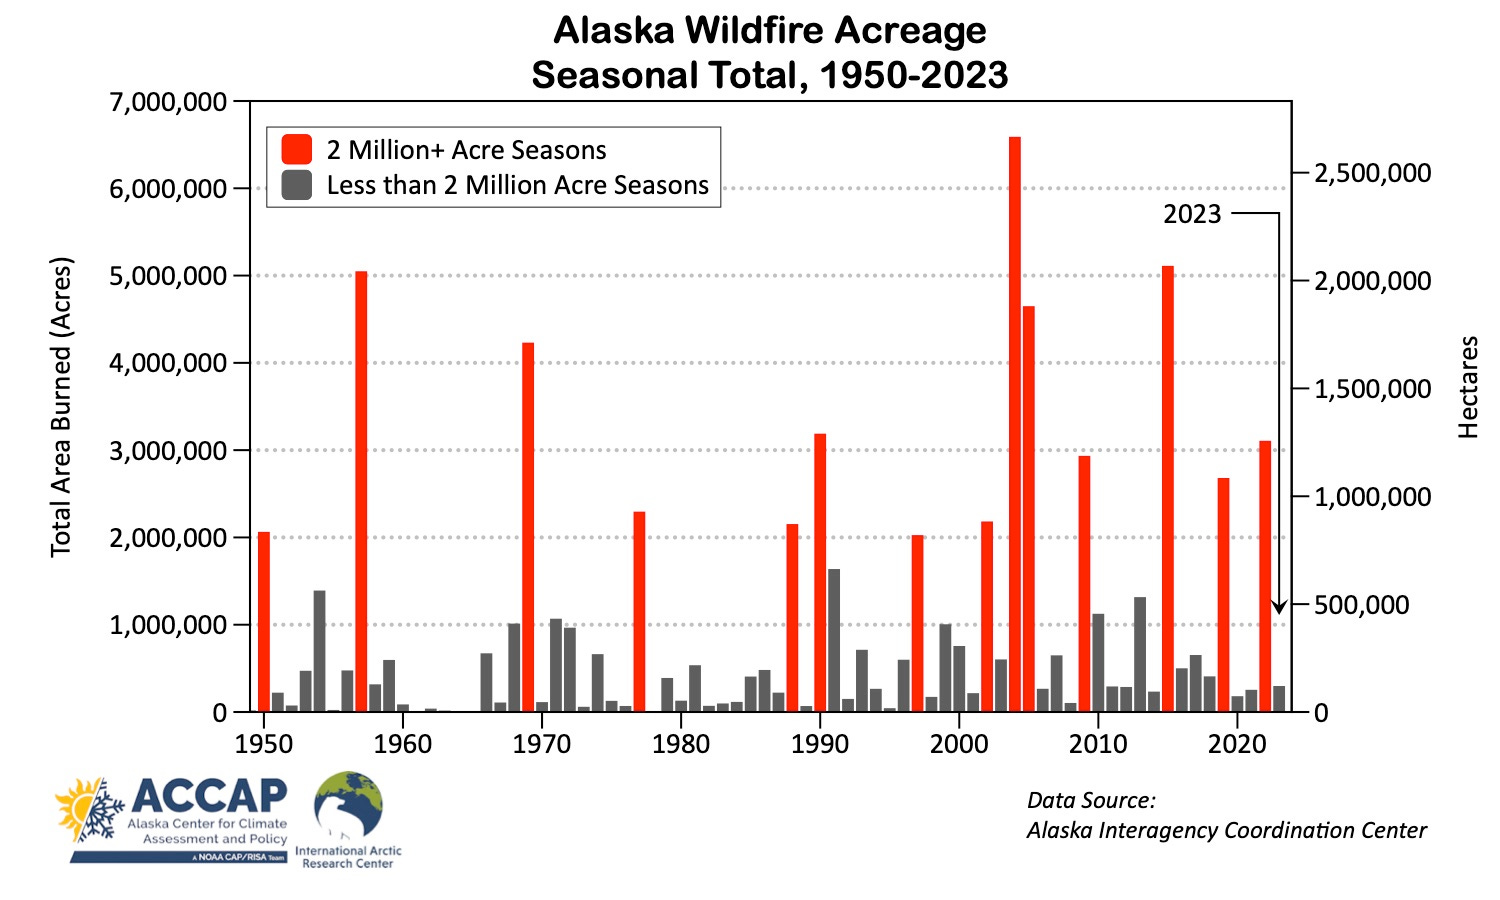
While the Alaska wildfires started too late in the season to grow really large by northern standards (the Delta fire, west of Delta Junction was the largest at 57,300 acres), multiple fires were close enough to populated regions for evacuation recommendations to several areas, including the Clear/Anderson area between Healy and Nenana, the Salcha River area and the Haystack subdivision north of Fairbanks.
With the fires bunched around Fairbanks, there was much more smoke than might have been expected given the relatively low acreage. In fact, Fairbanks Airport reported 151 hours with visibility restricted to 6 miles or less in smoke, all in August. While that total has been exceeded seven years in the past two decades, only two summers between 1952 and 2001 had more smoke hours than this summer.
Drivers of the Wildfire Season
In most years I would never show a 3-month average mid-atmosphere graphic to explain northwest North American wildfire, since in the wildfire season is usually significant shorter than three months. However, because the mid-level flow pattern was fairly stable this summer, fig. 5, showing the 500 hPa heights and departures from normal for June through August does have value (think of this as mid-atmosphere equivalent of a surface weather map showing high and low pressure and the prevailing wind direction). Low pressure in the Bering Sea and high pressure over the southern Yukon dominated in the mid-atmosphere. This pattern suggests that the bulk of the wildfire Northwest North America wildfire would be in the NWT and the Yukon since this flow pattern would favor warm and dry conditions overall.

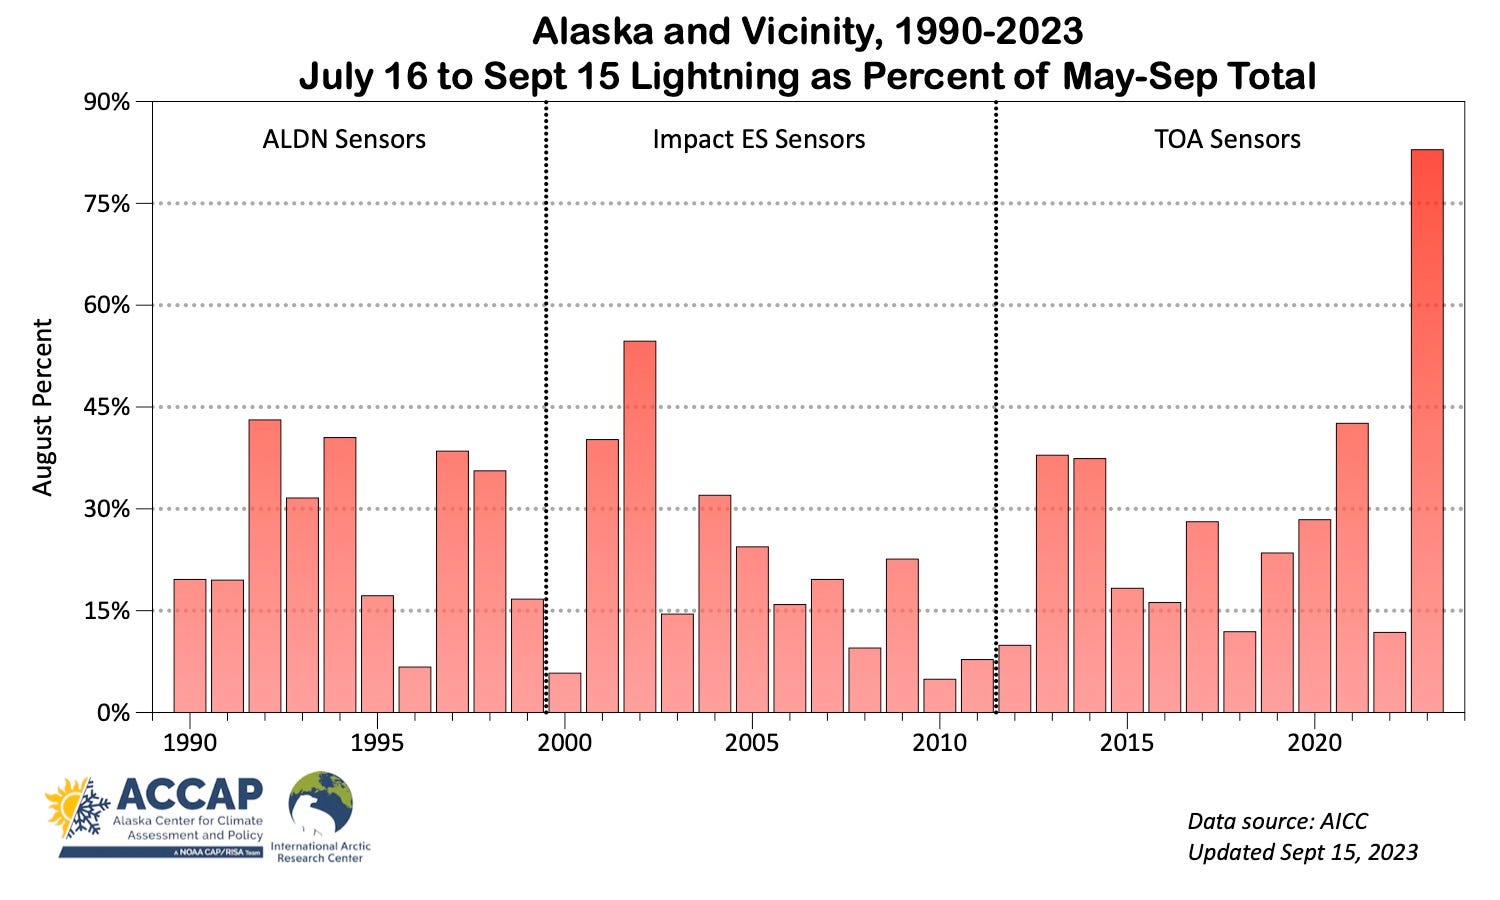
Thunderstorm timing was major player in Alaska’s wildfire season. Figure 6 plots mid-July to mid-September lighting strike count as the percentage of detected lightning strikes over the entire season. In the past 34 years there has not been a season anything like this year, with so much lightning coming so late in the season. This year, 86 percent of the total number of lightning strikes occurred after July 15 (1991-2020 median is 21 percent). The only other year to have more than half the lightning so late in the summer was 2002, which was a far more active season than 2023 but also saw a comparatively high percentage of wildfire burn occur late in the summer (59 percent of the 2.1 million acres burned after July 15).