

June 2024 Arctic Climate Summary
June 2024 Arctic Climate Summary
Sea Ice, Greenland Ice Sheet and Wildfire

Here’s the June update on Arctic sea ice, Greenland ice sheet melt and wildfire. I’ll cover temperature and precipitation once the ERA5 data for June 2024 is released.
Sea Ice
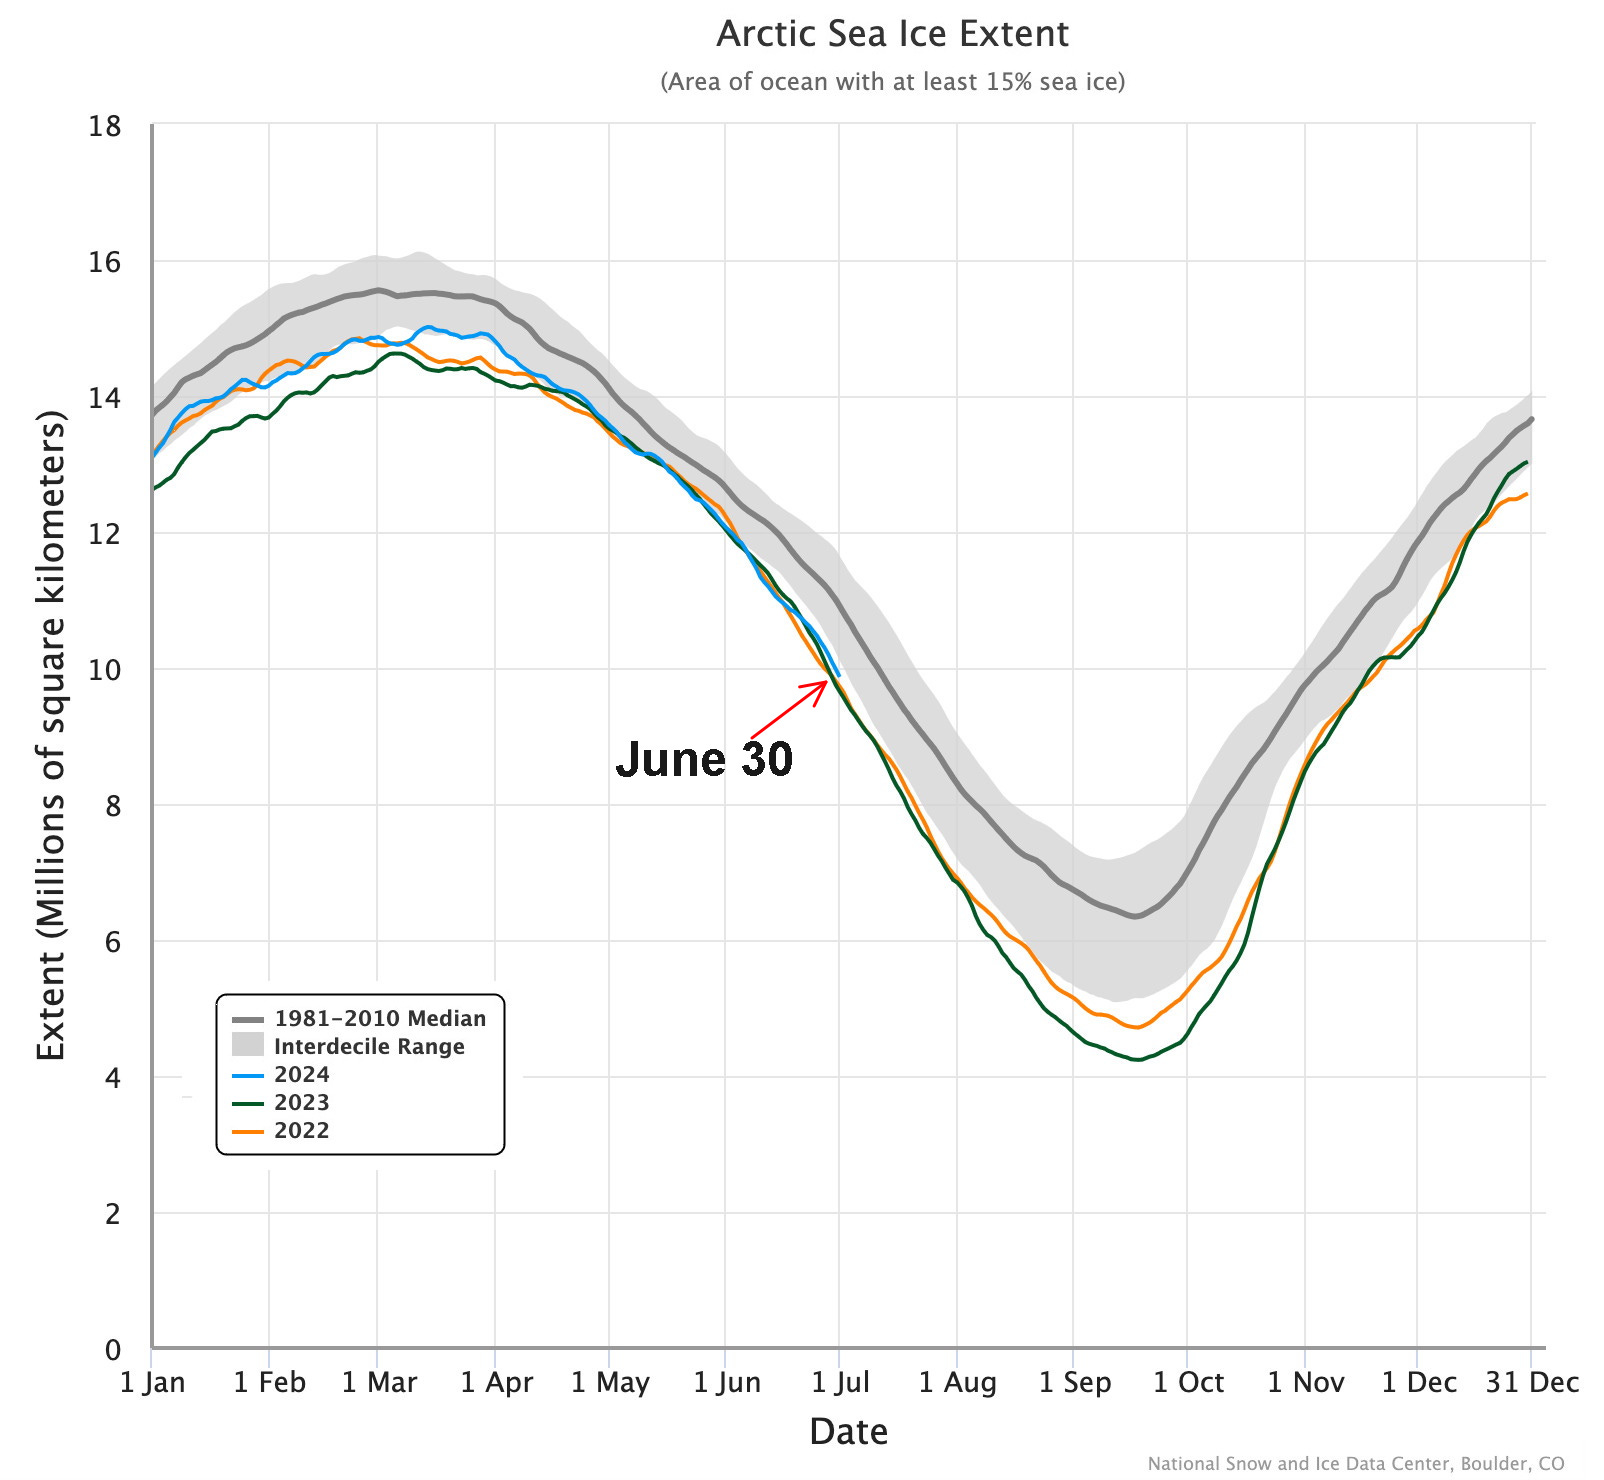
Arctic-wide sea ice extent in June tracked very close to both June 2022 and 2023, though of course far below usual late 20th century levels. Overall this was the 12th lowest June average extent since 1979.
Regionally, there have only been minor adjustments in sea ice extent rankings (Fig. 2) since my mid-June sea ice post. Hudson Bay finished up with the lowest June sea ice extent in NSIDC analysis since 1979, while the Chukchi sea had the highest average June extent since 2000.
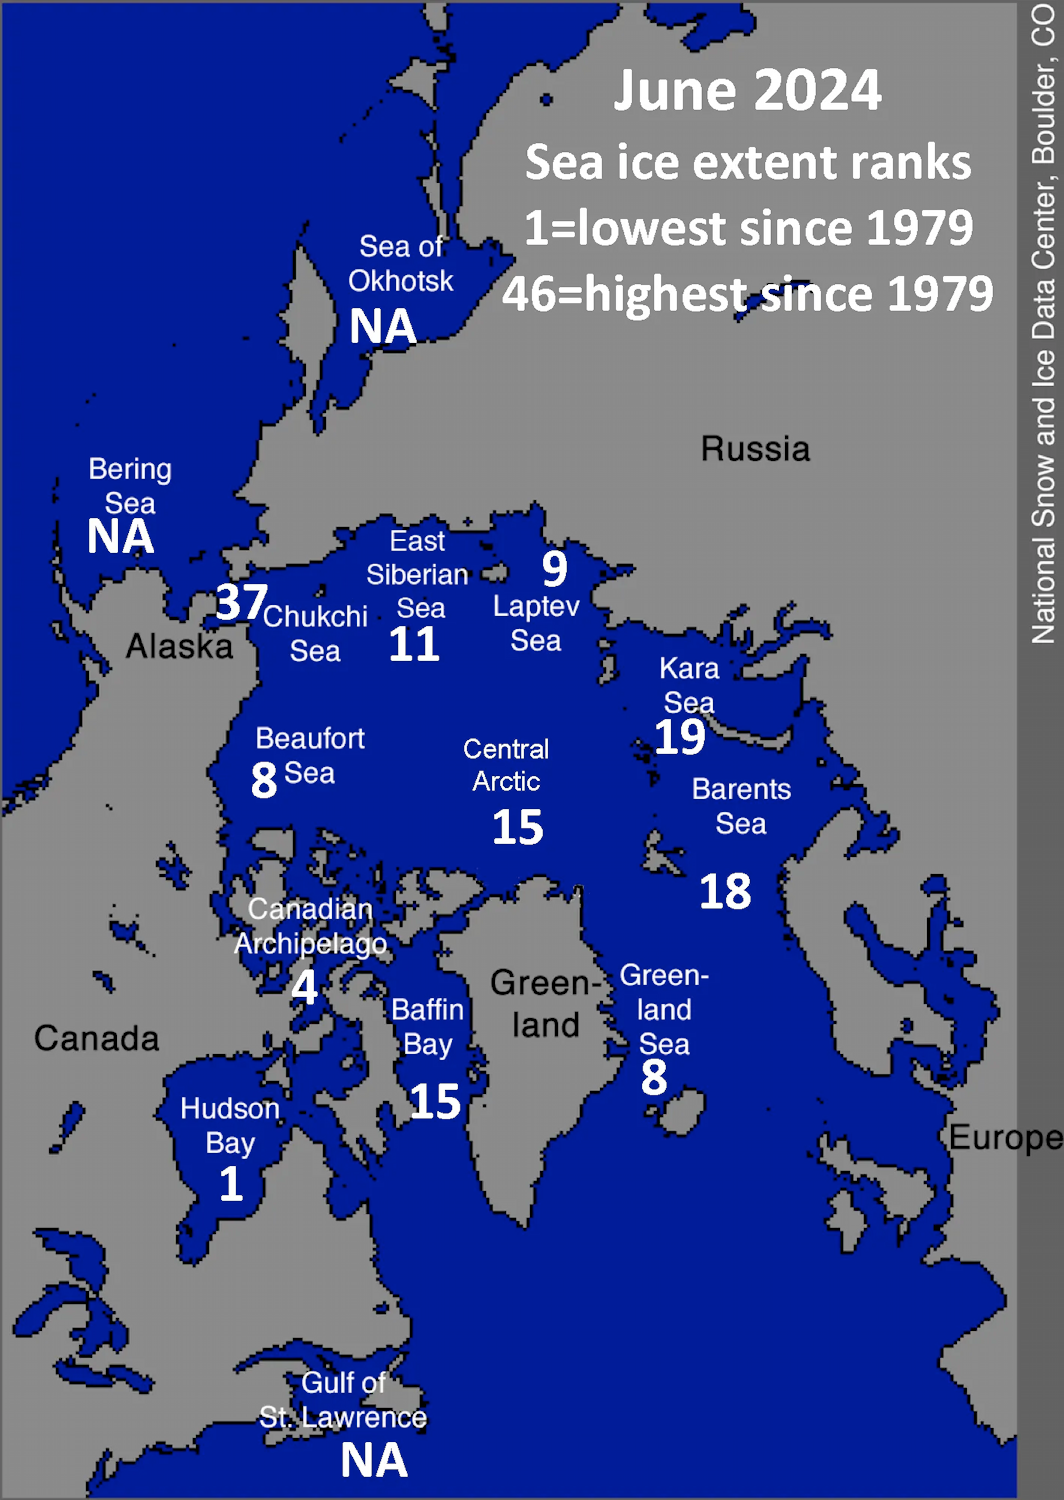
Note in fig. 2 that no other sea has anywhere close to the anomalously high extent found in the Chukchi Sea, a sure sign that the Chukchi extent is the result of a combination of regional factors likely related to winds and spring sea ice thickness, rather than any “Arctic-wide” recovery.
Greenland Ice Sheet
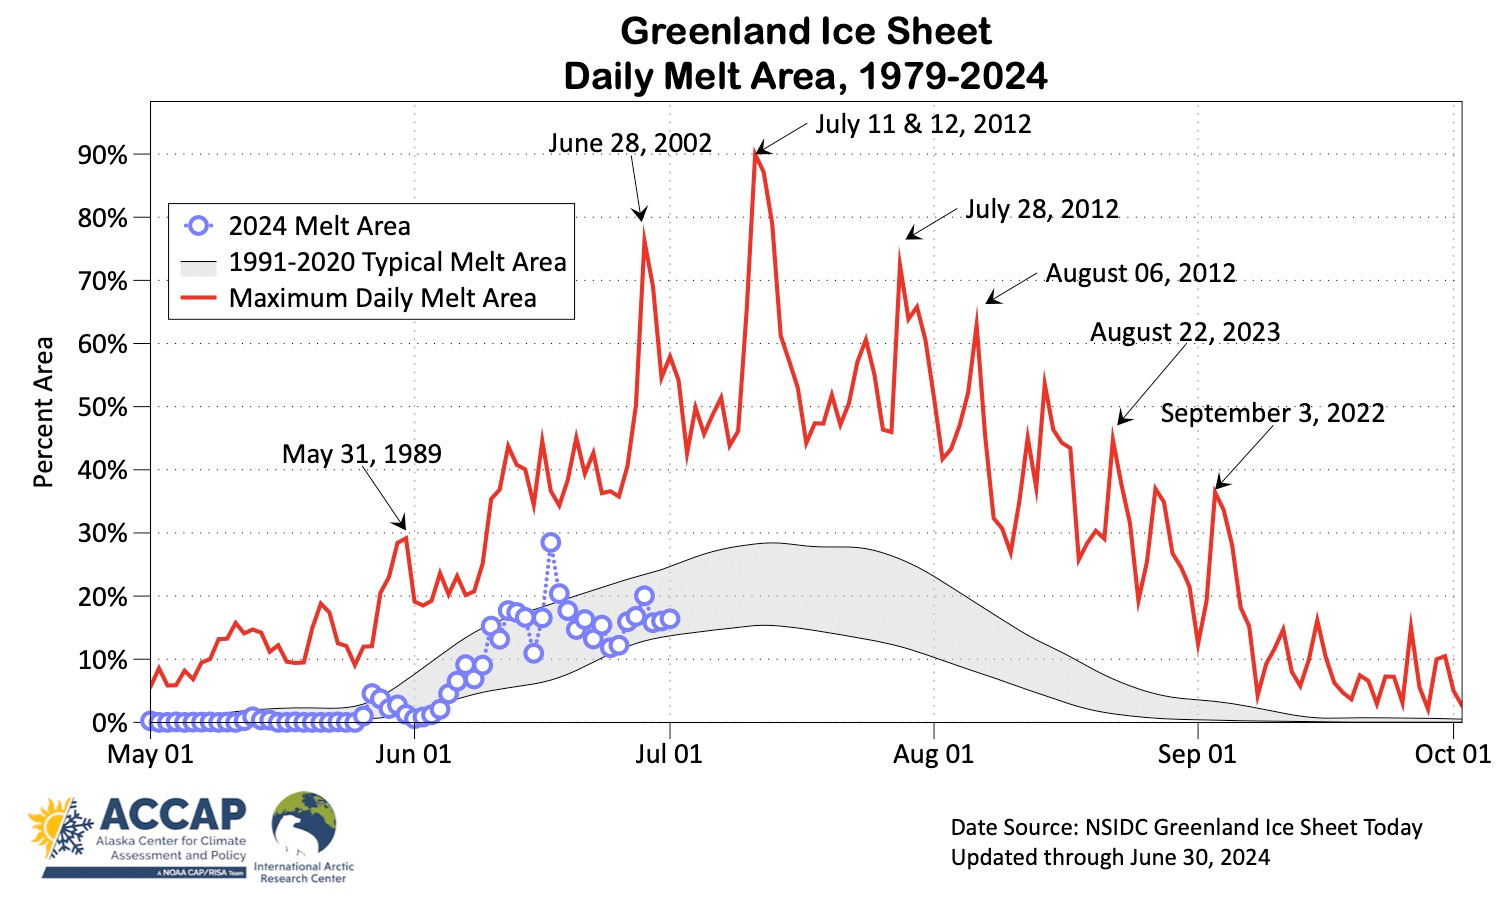
Melt on the Greenland ice sheet for most of June was typical for recent years, and unlike late June 2023, there were no days with near record melt area.
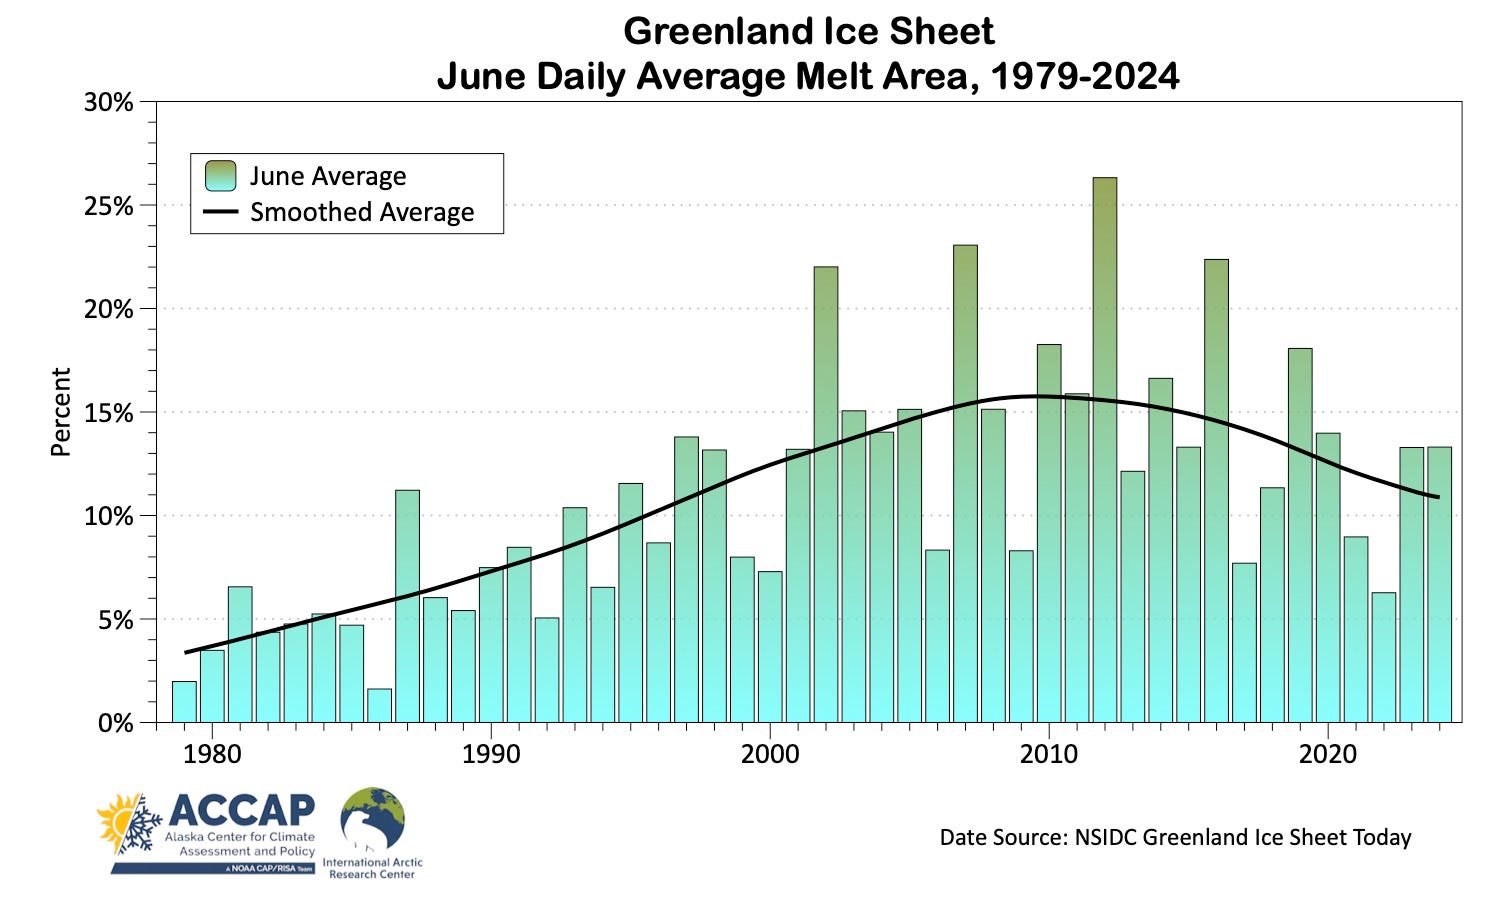
The average daily June melt area since 1979 is shown in Fig 4. The melt area this June was very close to the 1991-2020 average and effectively the same as in June 2023.
Wildfire
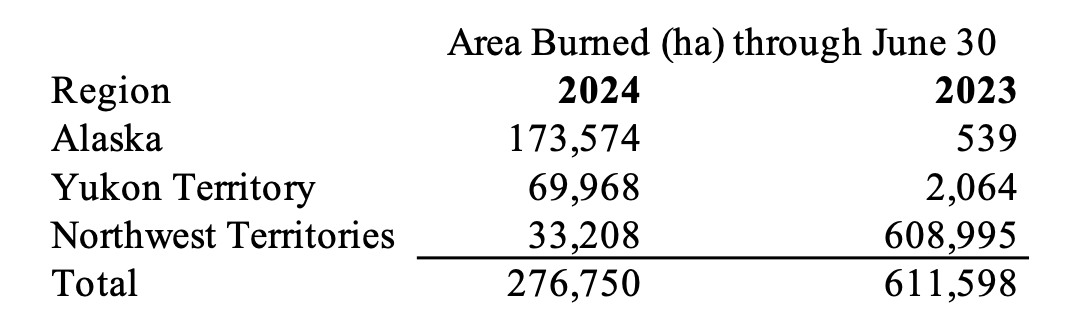
Northern North America wildfires through the end of June had burned more than 276,000 ha (683,000 acres), with more than 60 percent of that total in Alaska. This is less than half of the total burned to this point in the season last year, but in 2023 more than 99 percent of the total area burned through June was in the Northwest Territories.
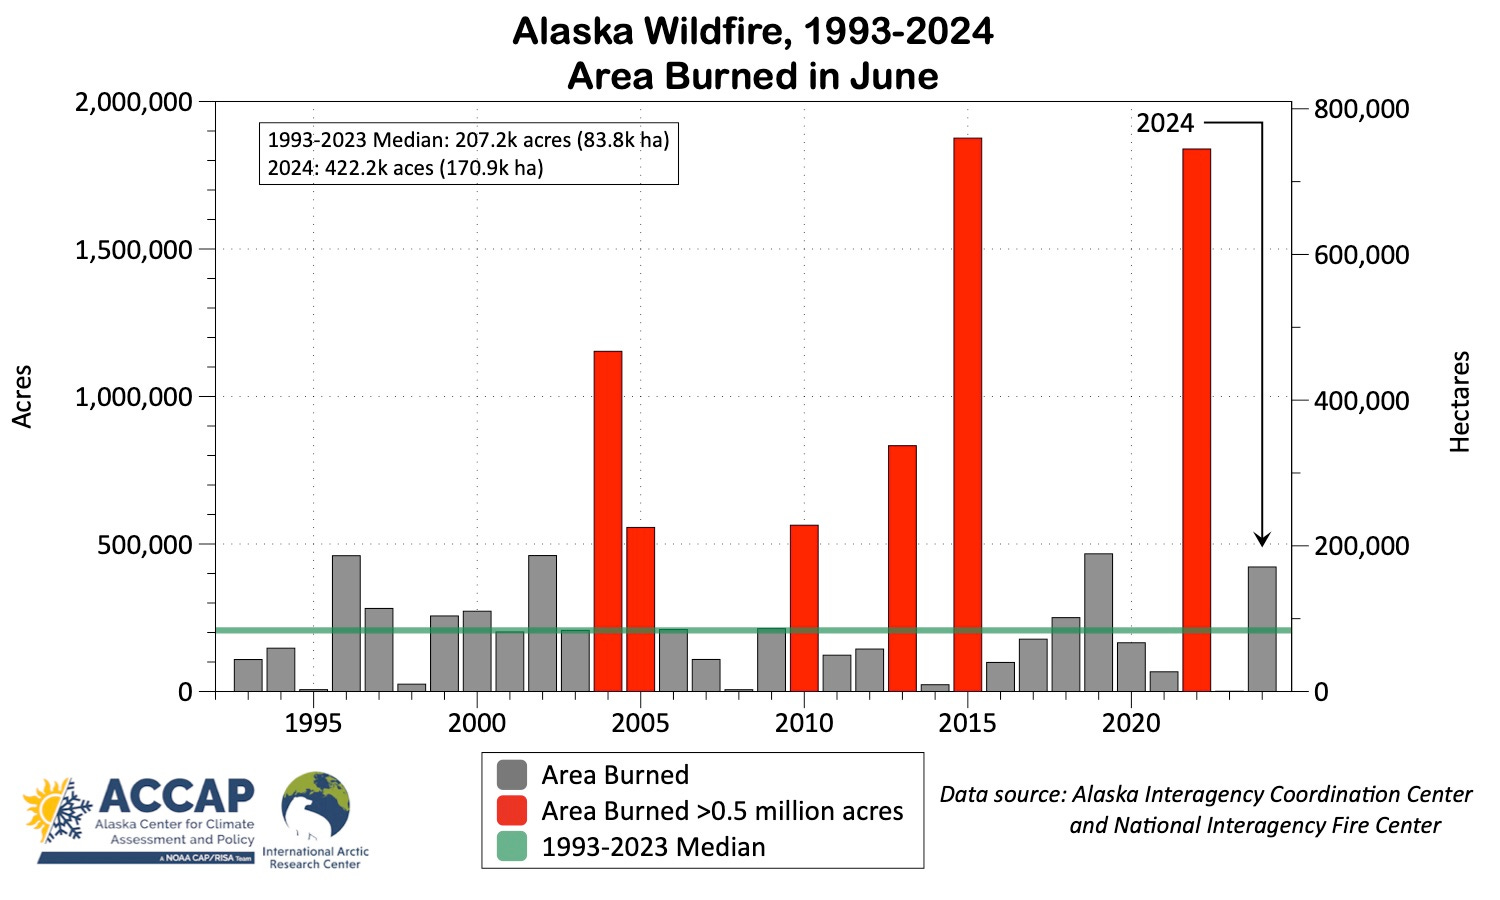
We have daily estimates of wildfire acreage in Alaska since 1993. From Fig. 3 we see this June the area burned (422,212 acres, 170863 ha) was above the 1993-2023 median but not dramatically so.
We can be sure based on satellite derived estimates that summer 2024 has been an active wildfire year in Sakha Republic (central and eastern Siberia), though reliable near real-time information on Russia Arctic wildfires is always hard to come by. Euronews on June 28 reported 460,000 ha (1.14 million acres) burned through June 24, while a July 1 article from Reuters reported 331,000 ha (817,900 acres) burned, but no date was provided.
Very interesting data Rick.
Thank You !!
-Rich-