July 2024 Arctic Climate Review
July 2024 Arctic Climate Review
Part 1: Sea Ice, Wildfire and Greenland Ice Sheet

Here’s the July update on Arctic sea ice, wildfire Greenland ice sheet melt. I’ll cover temperature and precipitation after the ERA5 data for July 2024 is released.
Sea Ice
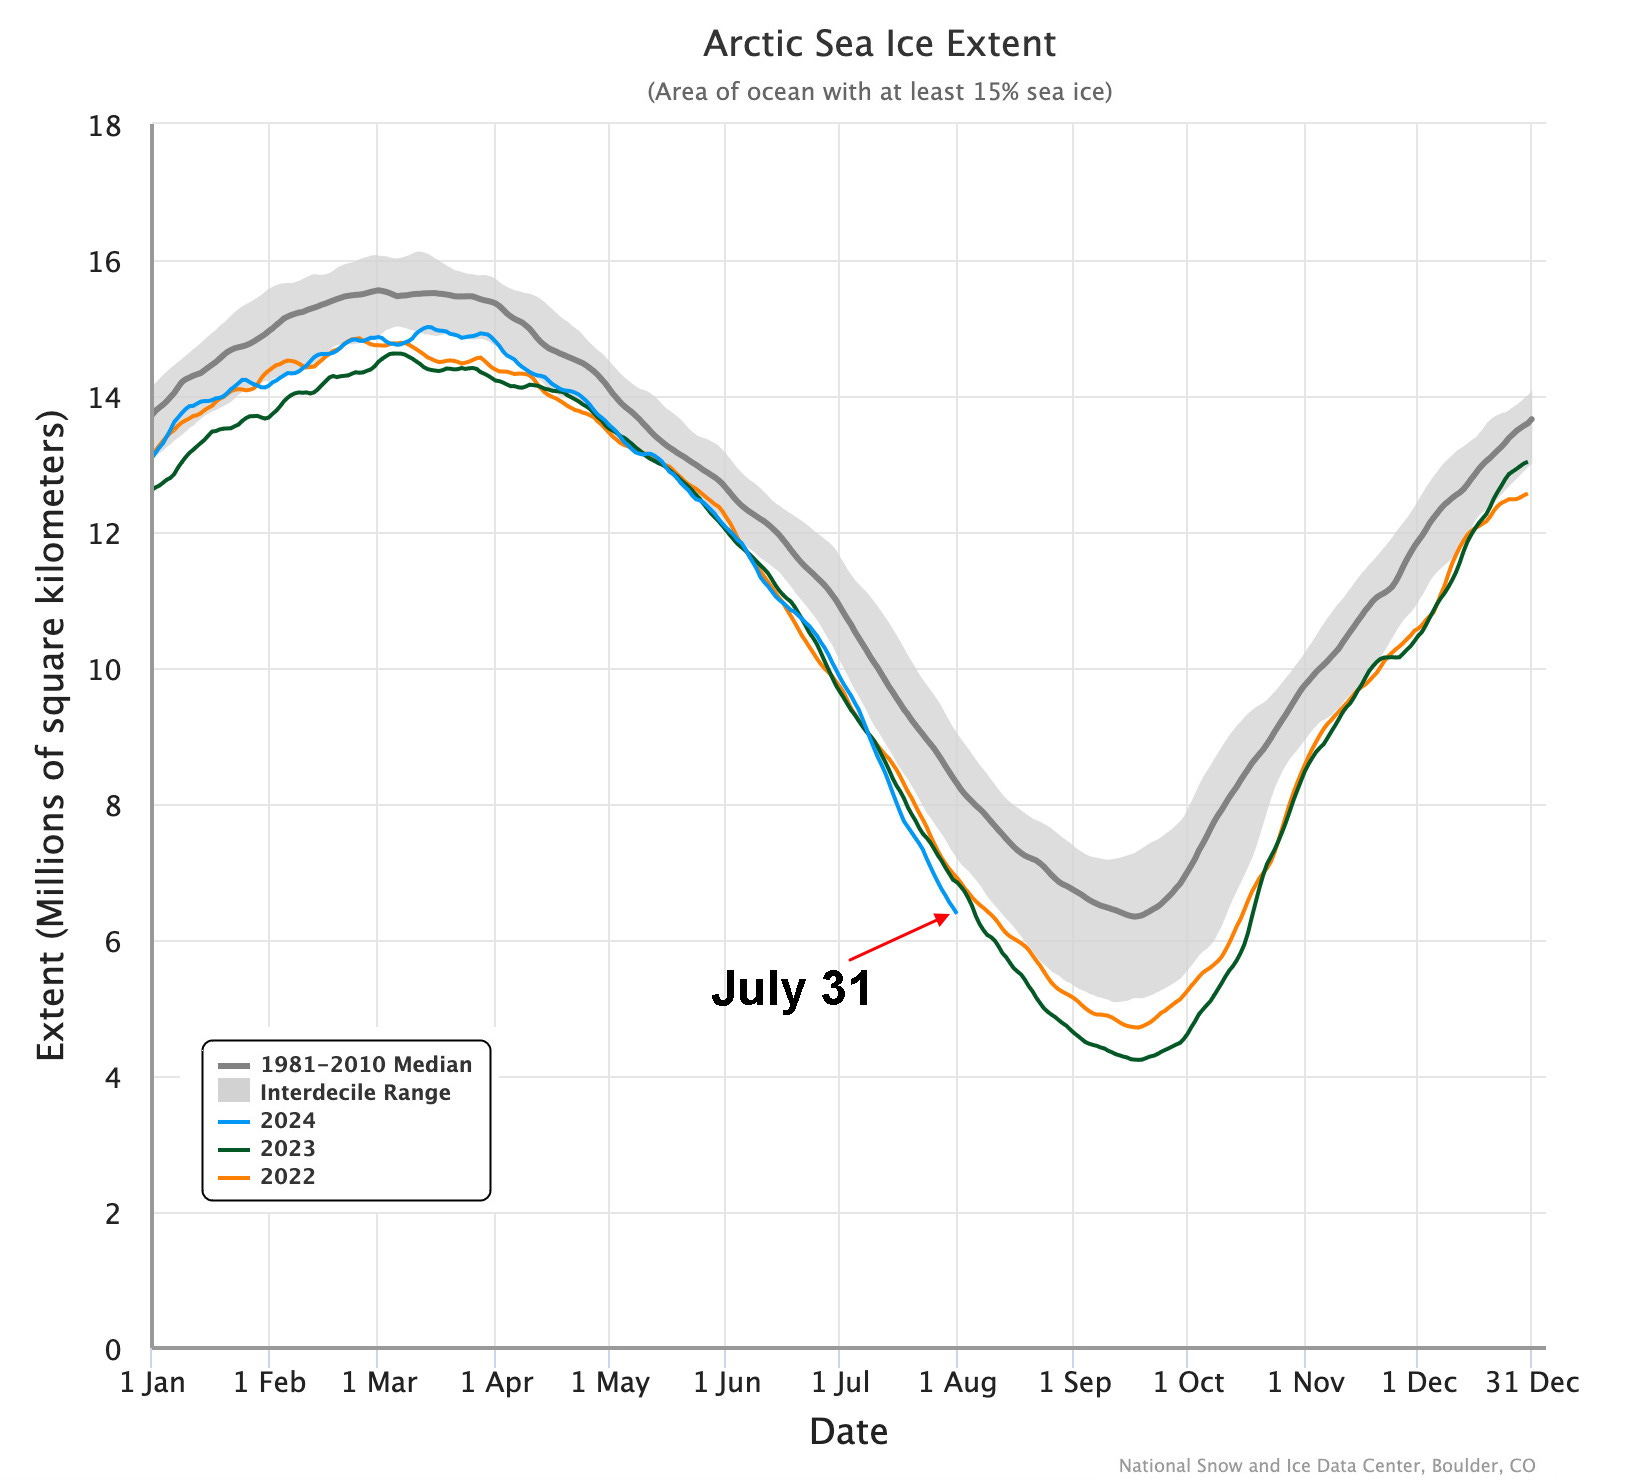
Sea ice extent in the Arctic decreased steadily in July (Fig. 1), which is usual for this time of year. The overall decrease from June is slightly more than is usual: 27 percent decrease from June this year, compared to the 1991-2020 average June-to-July decrease of 22 percent. At the end of July, the Arctic-wide sea ice extent was lower than the past couple of years and the sixth lowest overall.
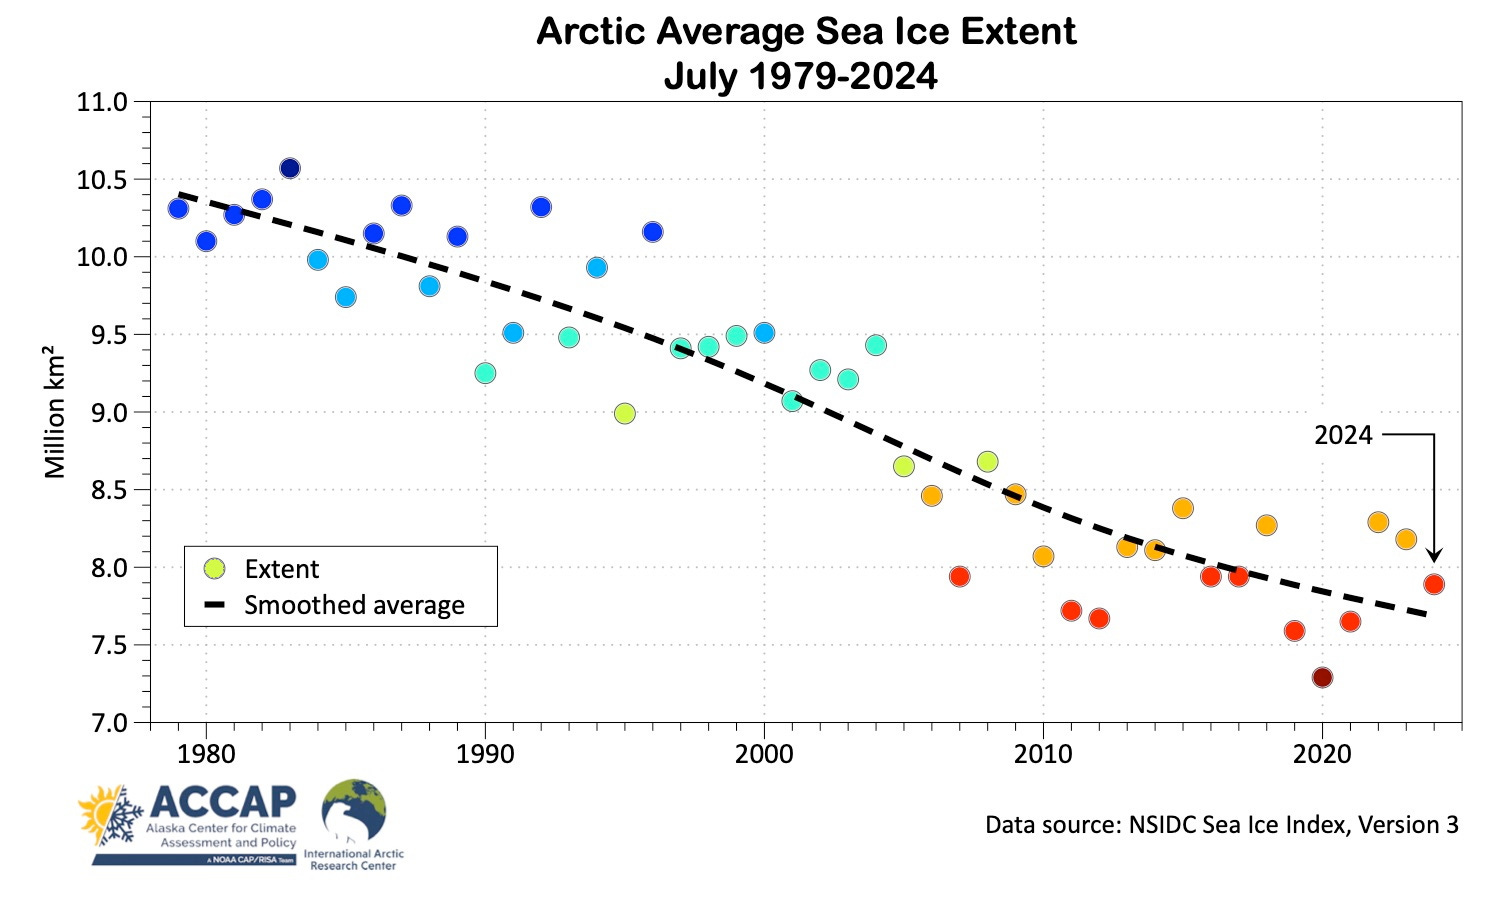
The July average sea ice extent since 1979 is plotted in Fig. 2. Like many summer Arctic sea ice variables, July extent shows a step change between 2006 and 2007, with a fairly steady trend downward on top of that change. This July was quite close to what we expect given the long term trend.
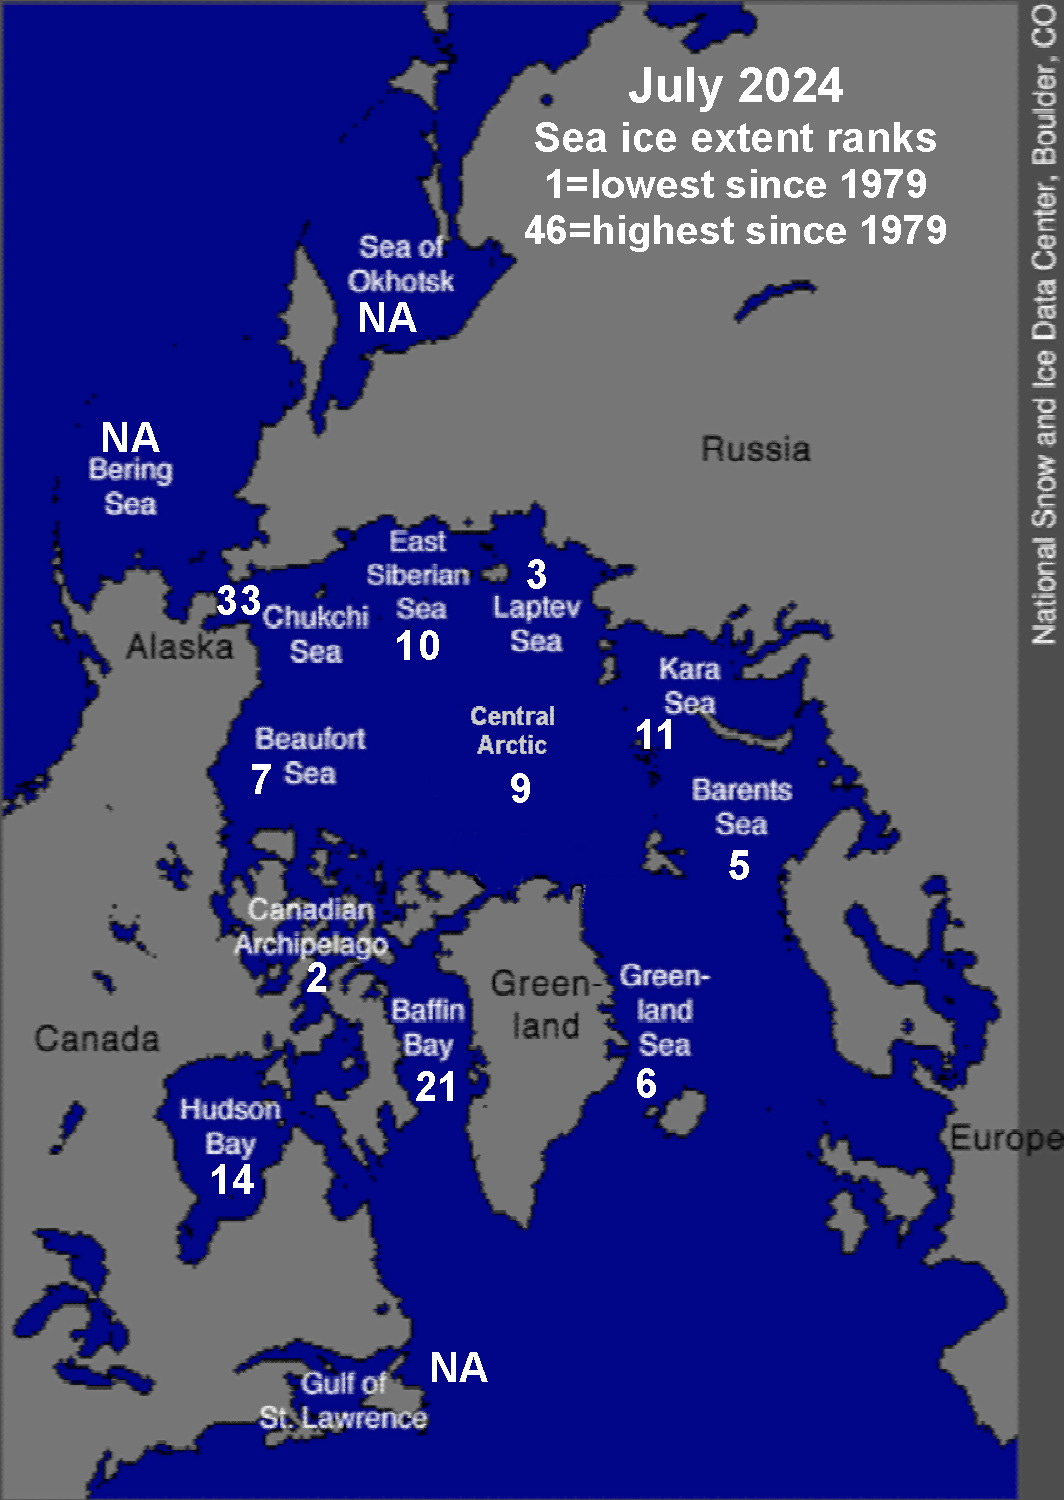
Regional sea ice extent in July (Fig. 3) showed a couple of interesting features. Unlike some summers, when either one side or the other of the Arctic Basin has especially low ice, there are very low extent in some of the regional seas on both the Eurasian and North American sides of the North Pole. The Chukchi Sea remains the most significant high-extent outlier, thanks in part to an extensive area of thick ice in the southwest Chukchi Sea, between Wrangel Island and the northeast Chukotka coast. Between Greenland and Canada, Baffin Bay ice extent remains moderately high, in part due to a cool early summer season in that area.
Wildfire
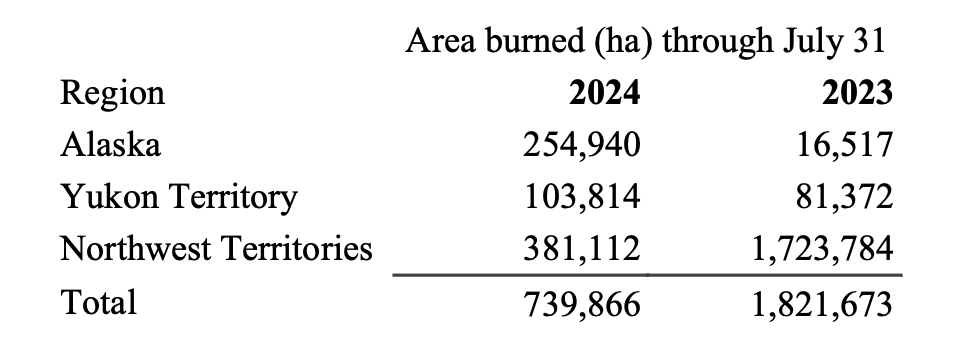
Through June the northern North American weather pattern favored wildfires in Alaska and the western Yukon Territory, with warm and dry conditions dominating, but the pattern reversed in July, with a dramatic increase in wildfire in the Northwest Territories and a dramatic slowdown in Alaska. As is often the case, the Yukon Territory was in between. Overall though, because 2023 was such an extreme wildfire summer in the Northwest Territories, the total area burned in northern North America this year through the end of July was only 41 percent of last year, even though both Alaska and the Yukon Territory were well ahead of 2023.
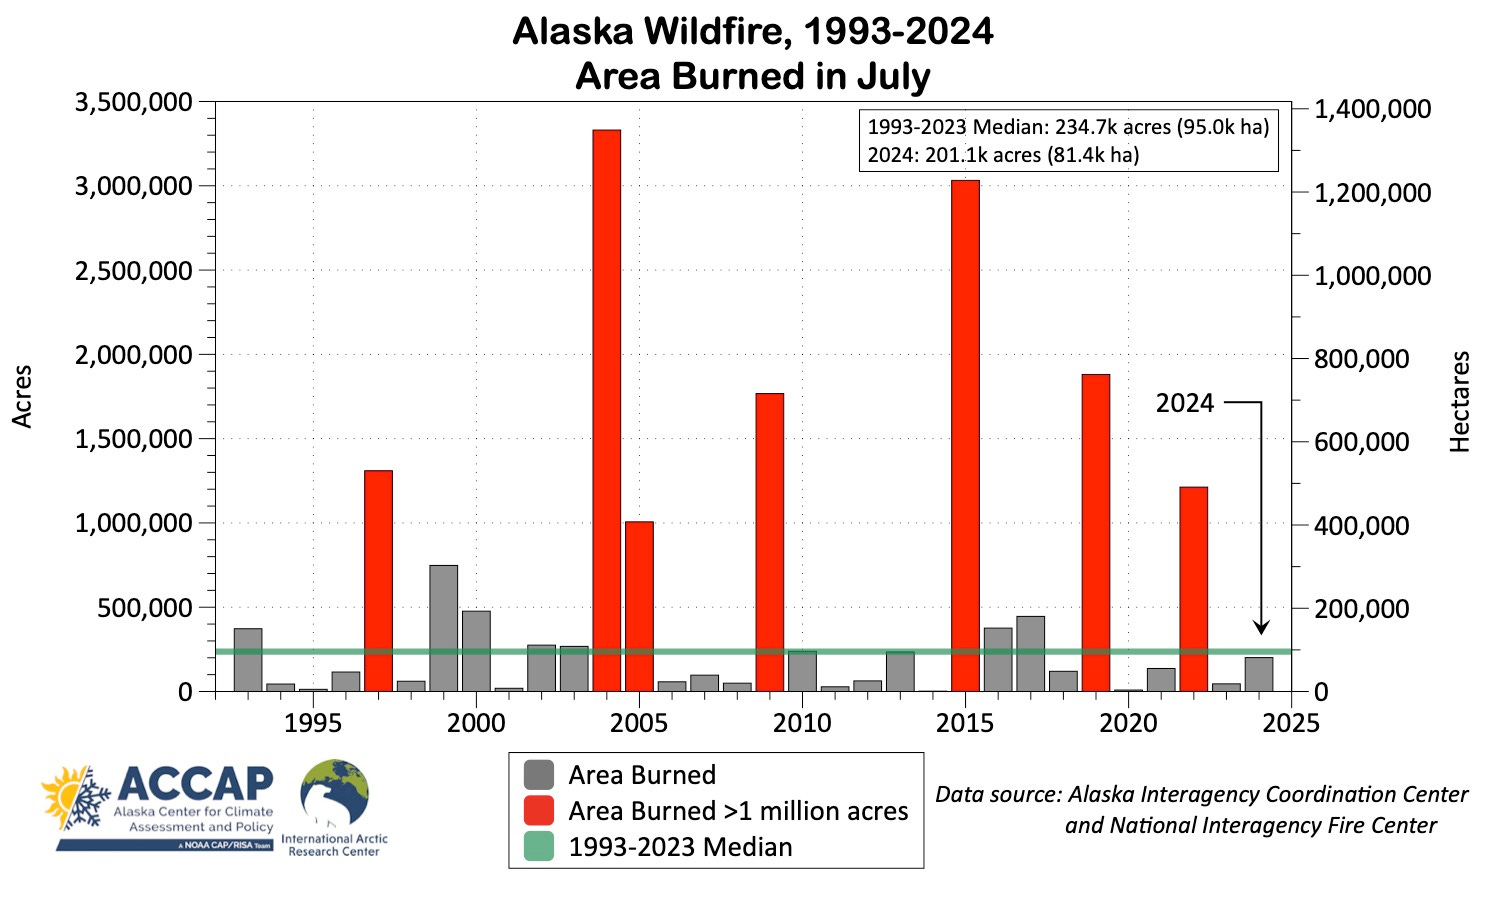
In spite of a sharp heatwave July 20-25 over mainland Alaska, the month overall was cool and rainy in most of the wildfire-prone areas in the state, and there was very little thunderstorm activity during the month. Total number of lightning strikes counted by the BLM’s Alaska Lightning Detection Network was only 27 percent of June’s total, which itself was not especially high. As a result, of the total of 201,100 acres (81,400 ha) that burned in July, only about 1,700 acres (680 ha) burned in fires that started in July, the other 199,400 acres (80,700 ha) were from fires that started in June. Fig. 4 shows the time series for July area burned since the early 1990s, with this year very close to the 31-year median.
Wildfire in the Russian Arctic continued through July as above normal temperatures persisted in the central and western Sakha Republic. According to a Moscow Times article dated July 23, about 4.9 million hectares (12 million acres) had burned for the season through mid-month for Russia overall, which is more than in 2022 or 2023 but no where close to the extreme 2021 wildfire season.
Greenland Ice Sheet
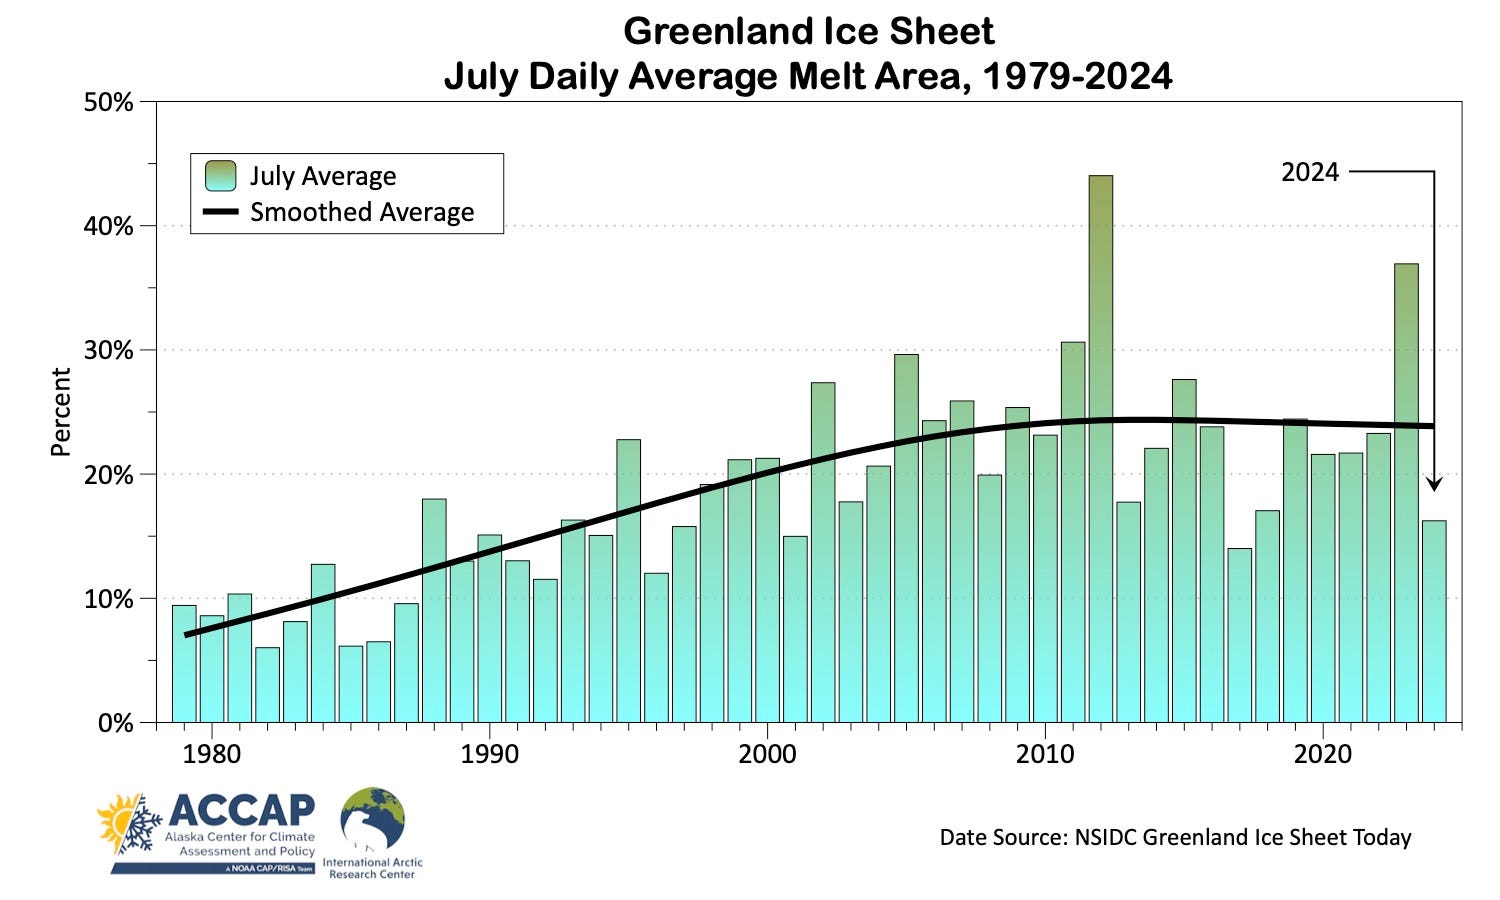
Melt on the Greenland ice sheet this summer has been pretty close to the long term average on most days, with no really widespread melt days at all. For July, the average daily melt area was over about 16 percent of the ice sheet, which is the lowest July average since 2017 (Fig 5). Melt on the ice sheet is strongly tied to peak solar heating, and being six weeks past summer solstice now, it’s unlikely that 2024 will be a big melt summer for the Greenland Ice Sheet.