

April 2024 Climate Summary
April 2024 Climate Summary
A bit of everything

April typically marks the transition season to summer in the lower Arctic while in the high Arctic temperatures are still mostly below freezing even as the midnight sun shines farther and farther south. Figure 1 shows the April temperature (°C) departure from the 1991-2020 average. The North American Arctic and Greenland generally saw average temperatures above normal for the month as a whole, while for Iceland and the European Arctic the month was overall cooler than normal. The Asian Arctic saw mostly below normal temperatures near the coasts and near to above normal averages over inland areas farther south. However, much of the Arctic Ocean basin was significantly cooler than normal, so overall the Arctic as a whole (lands and seas poleward of 60°N) was only 0.3°C above the 1991-2020 normal. Still, it was mild enough to rank as the 18th warmest April since 1950. For Arctic land areas only, the month ranked substantially higher, at ninth warmest since 1950.
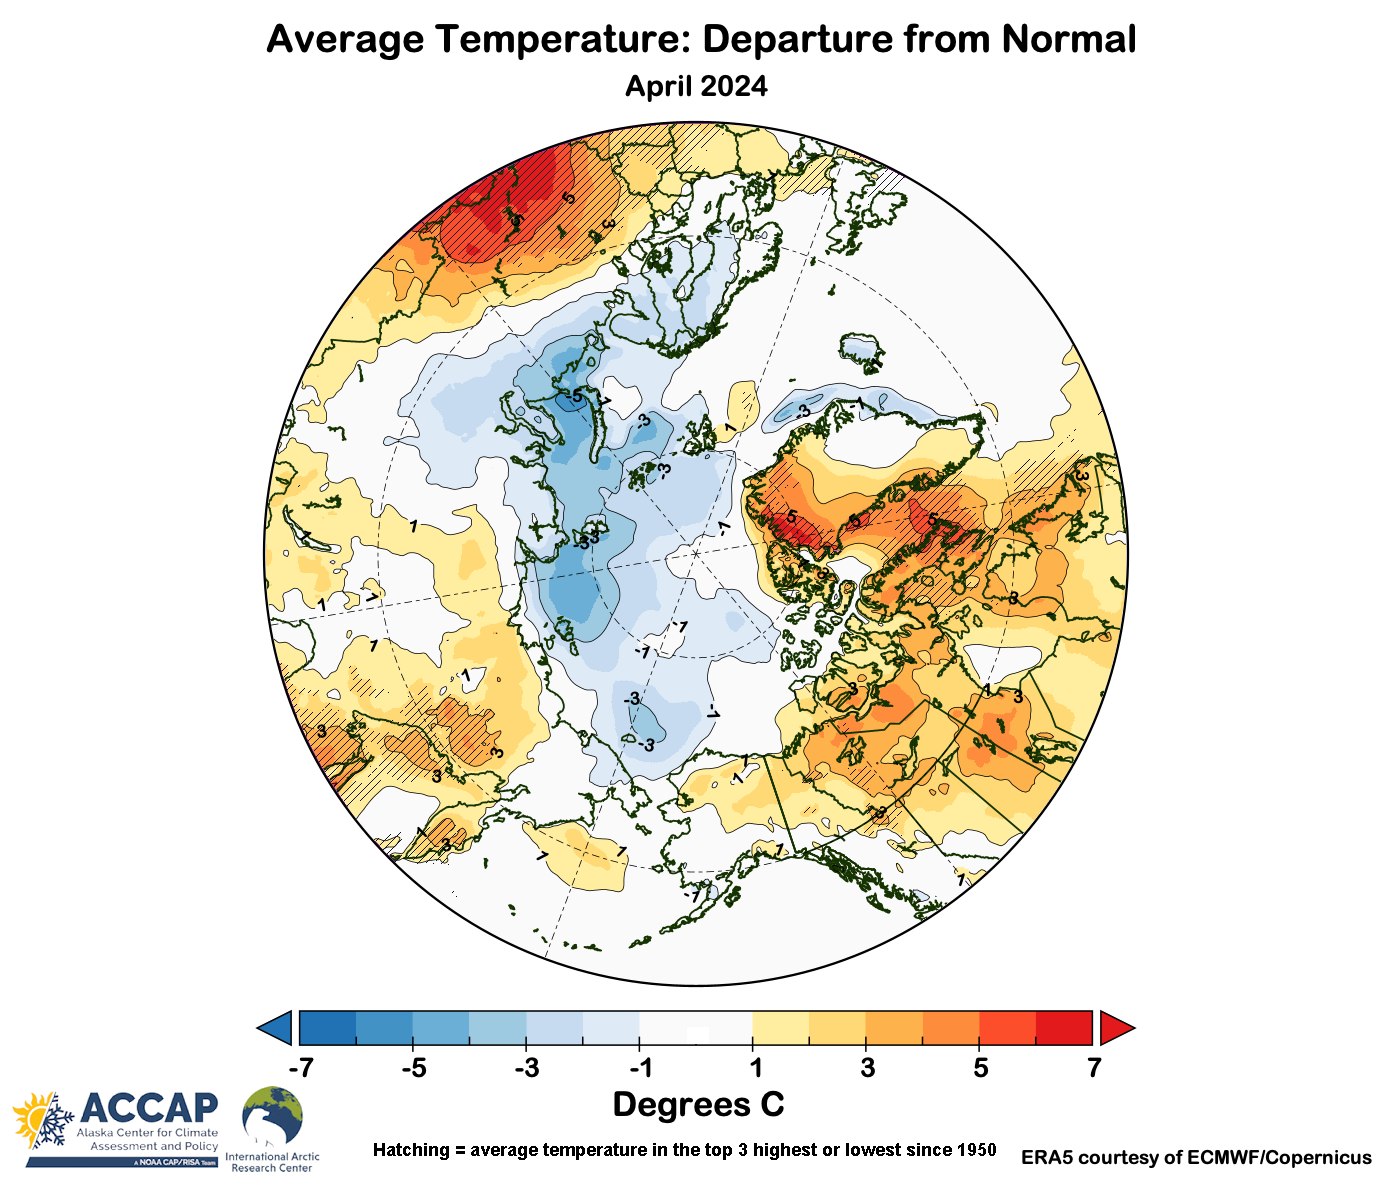
Arctic Canada was especially mild, with both Northwest Territories and Nunavut finishing up as the fifth mildest April since 1950.
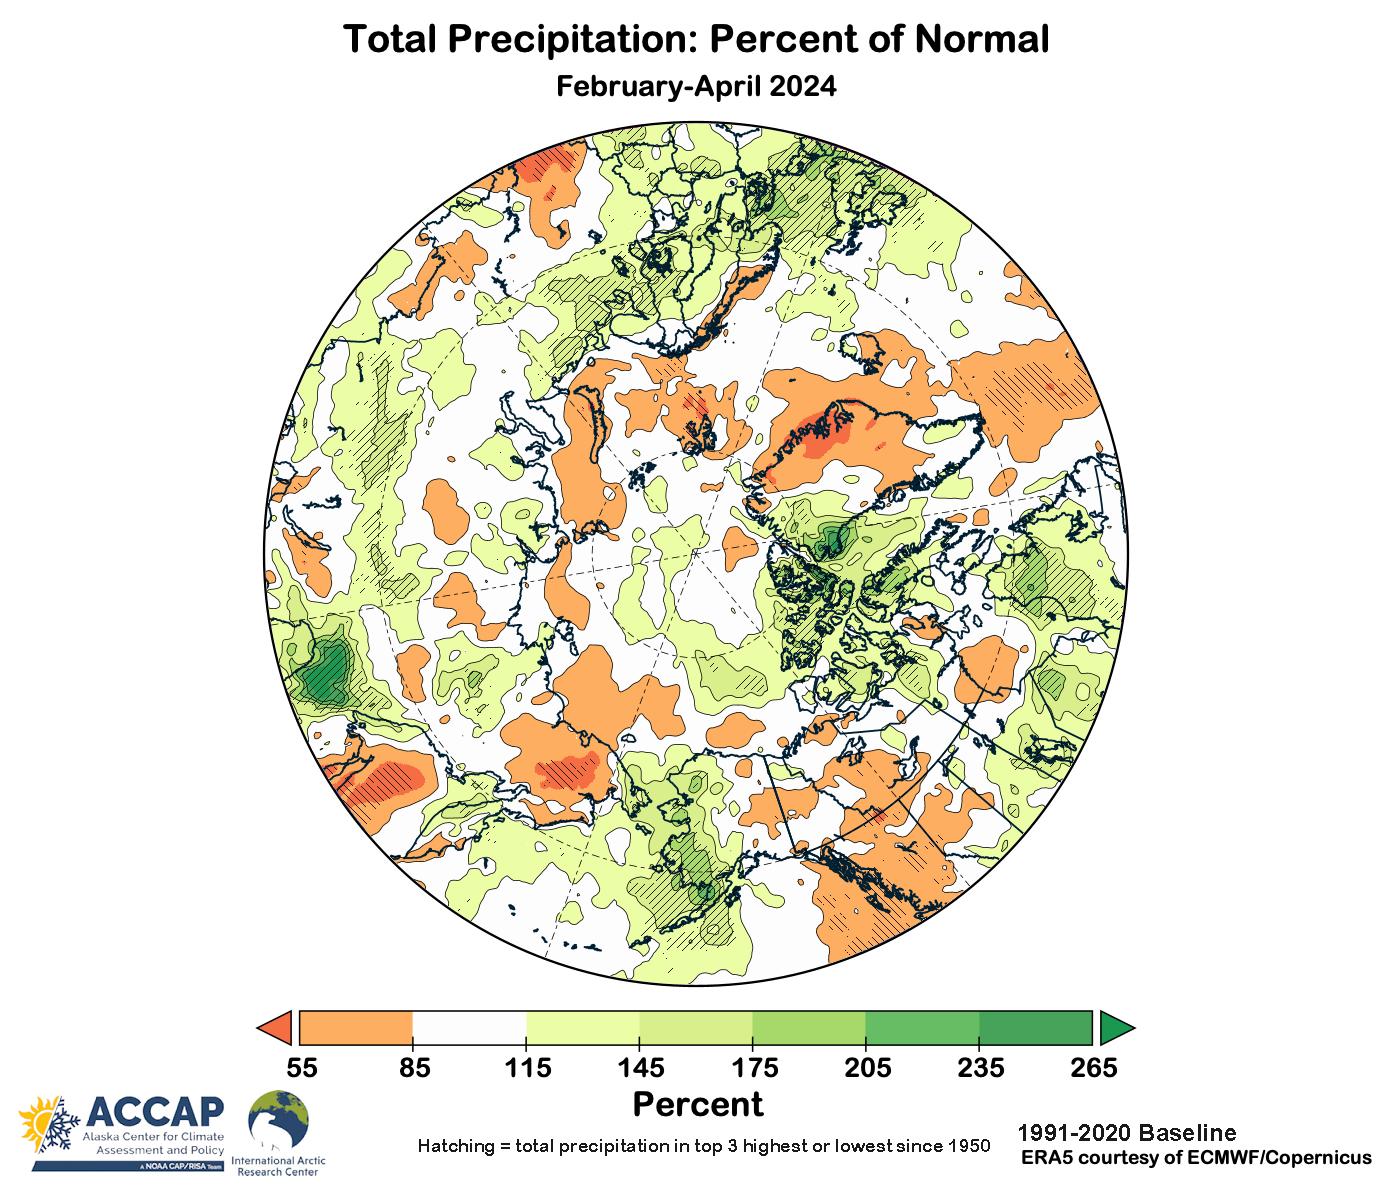
Precipitation (melted snow plus rain) was, as usual, much more variable than temperatures. Figure 2 shows the February through April precipitation totals relative to the 1991-2020 baseline. Western Alaska, northernmost Canada and northeast Greenland and much of the European Arctic had well above normal totals, while eastern Greenland, eastern Siberia and northwest Canada and eastern Interior Alaska had significantly less precipitation than normal.
Alaska and vicinity
Zooming into Alaska, April temperatures were well above normal across the Brooks Range and northeast Interior, extending east into the northern Yukon and Northwest Territories. The North Slope presents an interesting contrast, with near to below normal across the far northwest while the central and eastern area were (comparatively) mild. For Alaska as a whole this was the mildest April since 2020 and 17th mildest since 1950. Based on station observations, April temperatures in the state ranged from -35F (-37.8C) at Point Lay on the 9th to 69F (20.6C) at the Snettisham Power Plant and Metlakatla Power Plant cooperative sites and the Klawock automated airport observation the second half of the month.
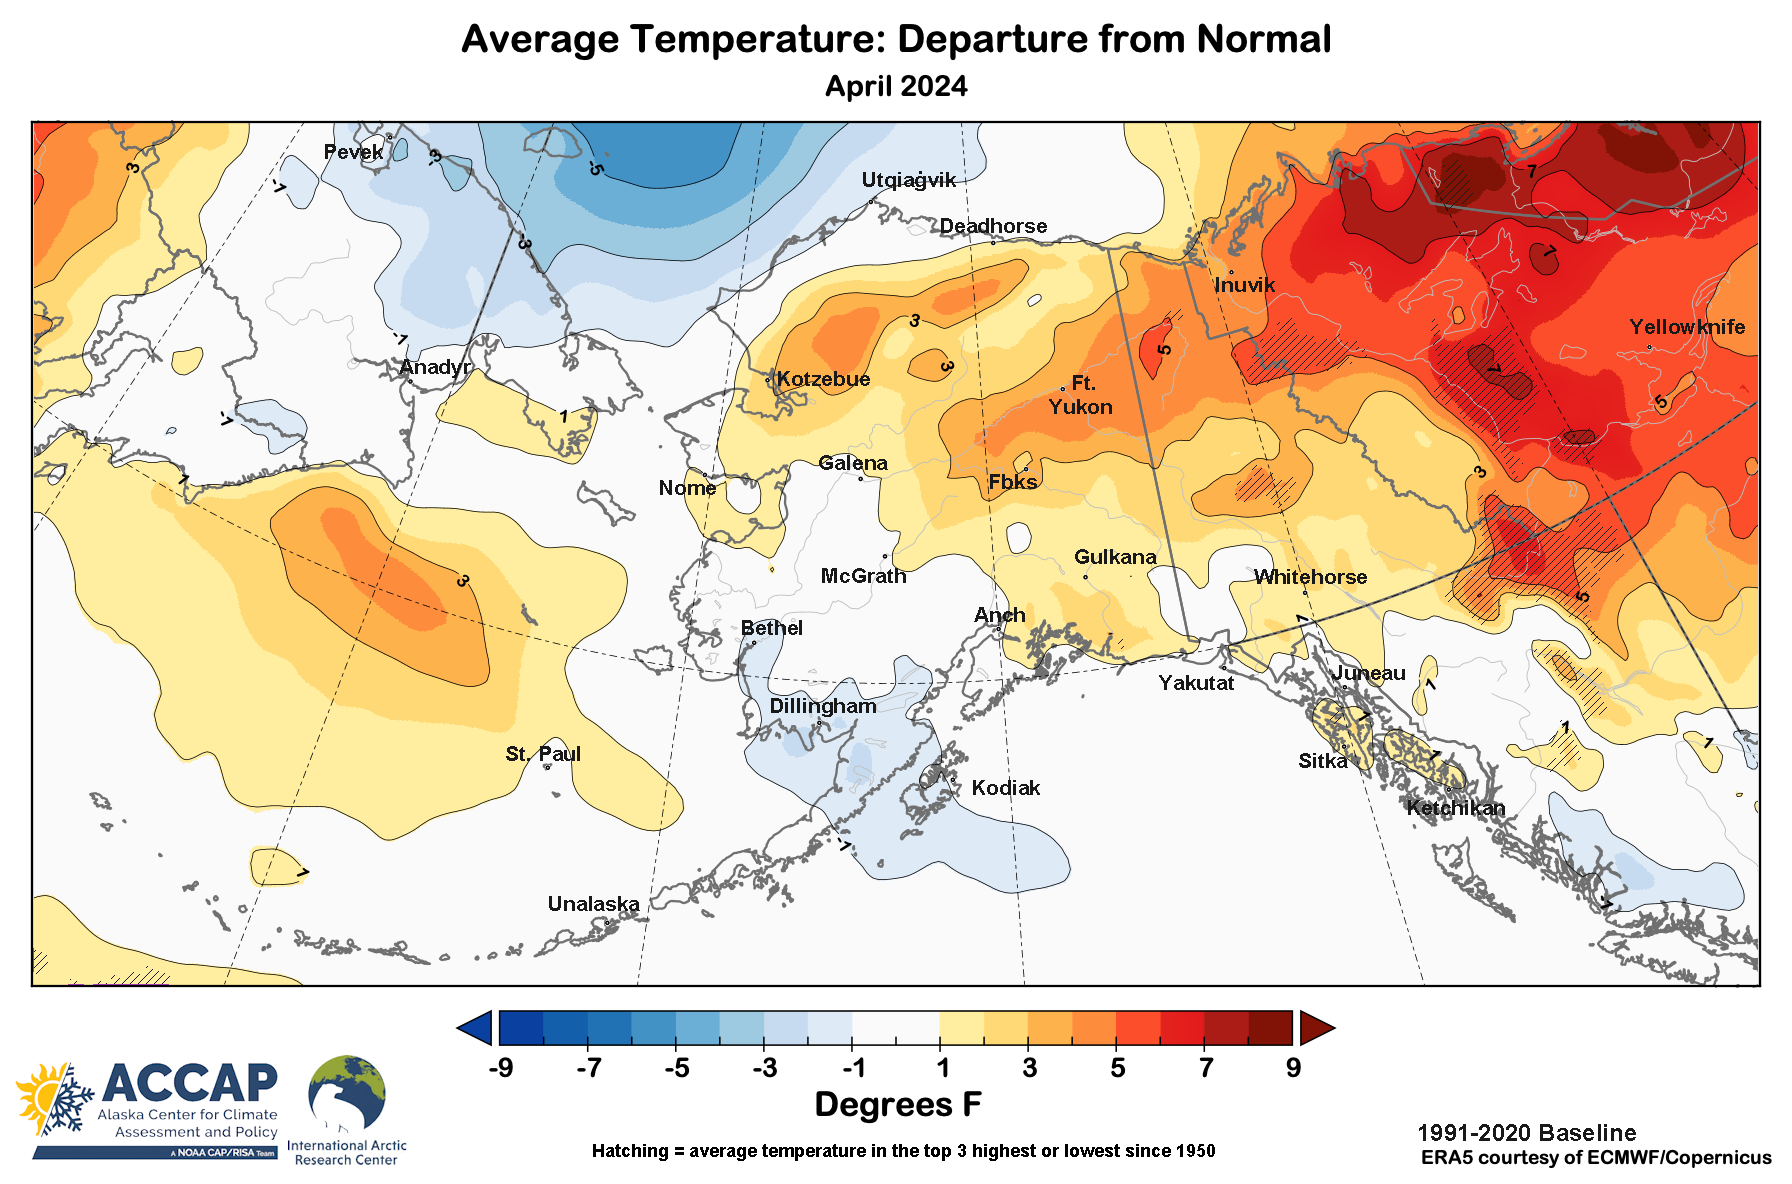
Southwest Alaska and the Kodiak area were cooler than normal in April. In one of those odd quirks that sometimes happen, at Kodiak Airport, the average high temperature for April was 42.5F (5.8C), the lowest since 2013, but the monthly high temperature of 61F (16.1C) on 28th was the highest April temperature since 2005.
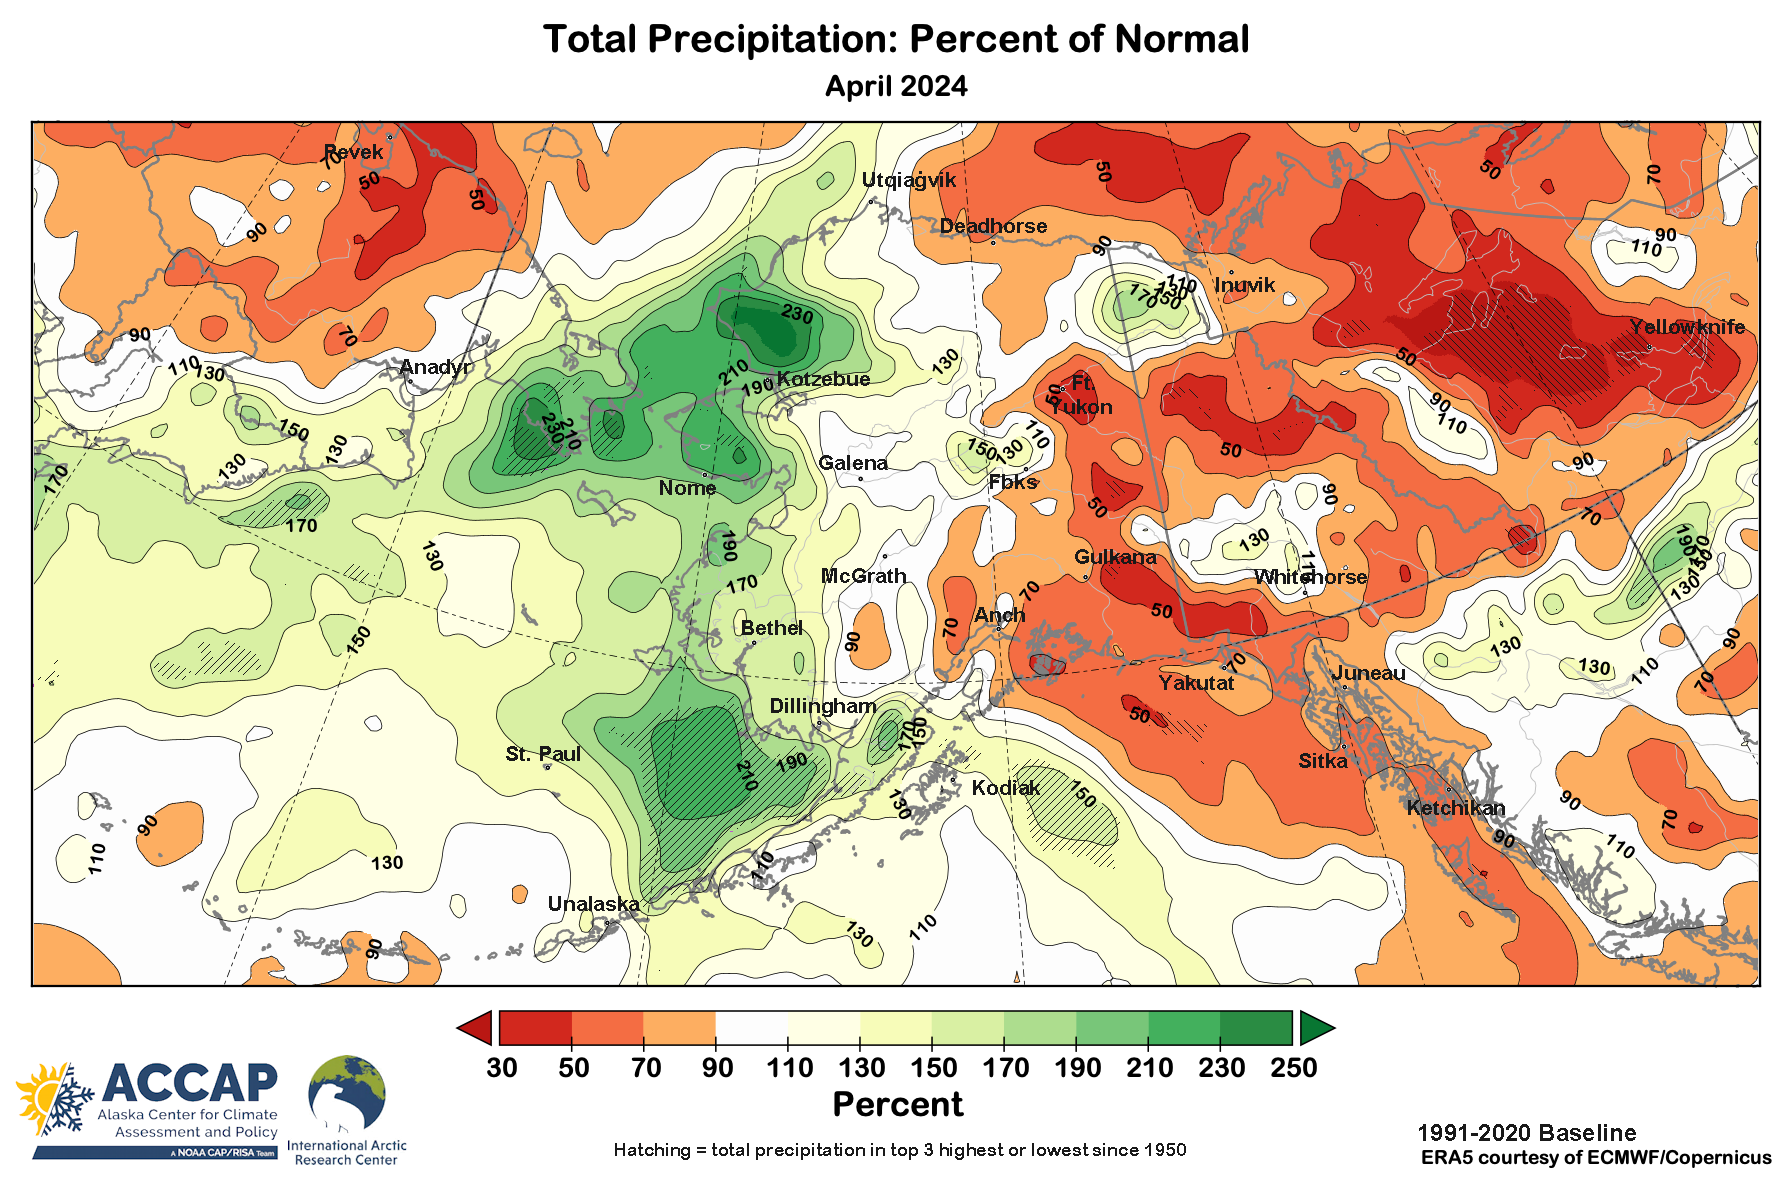
Precipitation across Alaska (Fig. 4) was generally split east to west across Alaska but with sub-regional exceptions. Like March, April had far above normal precipitation across western Alaska and Kodiak Island. At the station level, both Kodiak and Nome reported top five highest April precipitation totals in their century or more of climate observations. Most of southeast Alaska was drier than normal, and in southern Southeast this continues the pattern in place since January. At Ketchikan, the total precipitation for the first four months of 2024 was 33 inches, only 66 percent of normal and driest start to the year since 2002.
April’s average snowpack relative to the 1991-2020 median is shown in Fig. 5. Most of mainland Alaska had above normal snowpack except for an area on the west/north side of the Alaska Range from near Lake Clark northward across the upper Kuskowim valley and then eastward into the central Tanana Valley. Low elevation snowpack in Southeast was mostly non-existent.
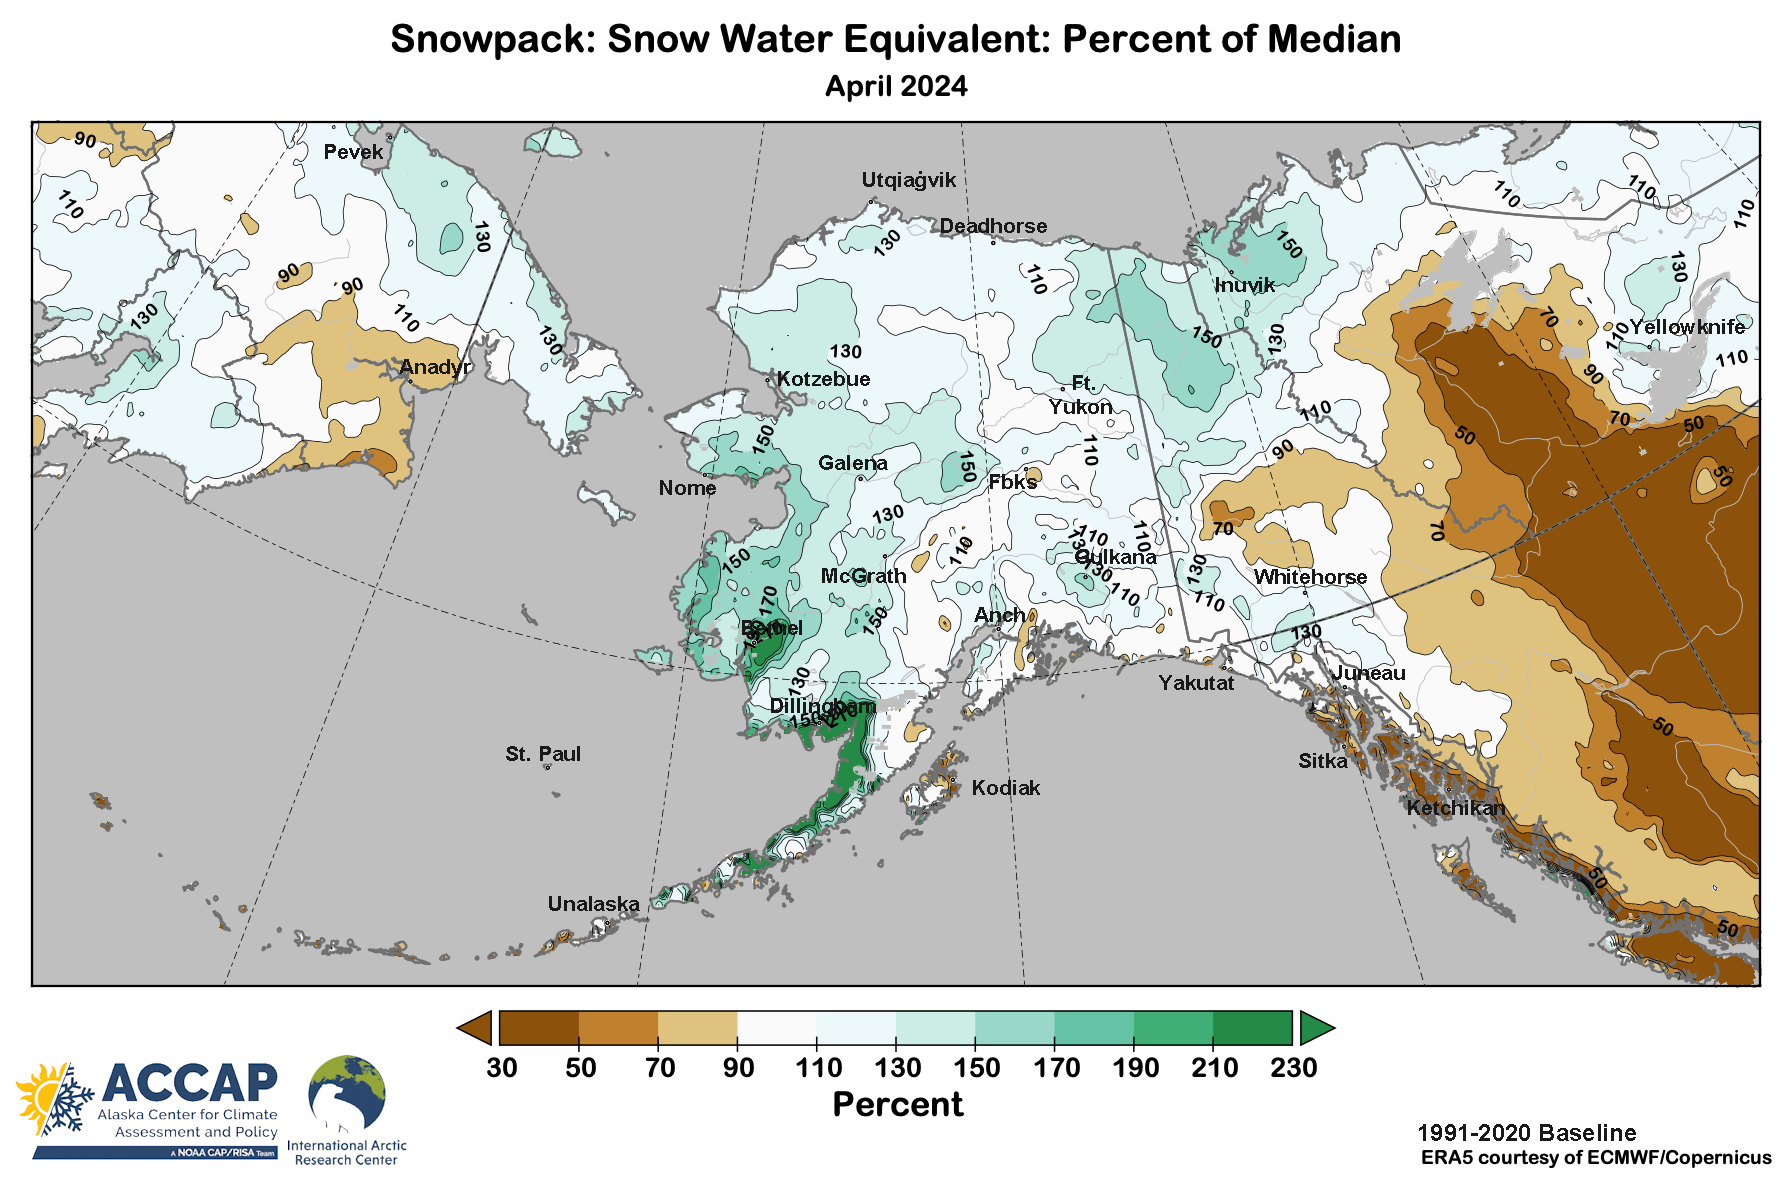
Monthly snowpack departures can be a tricky to interpret in areas where there is (climatologically) significant or complete snowpack melt out in April, since below (above) median snow is in part dependent on the timing of melt, with early (late) snowmelt, as well as the amount of water in the snowpack including the monthly average. For places like northwest Alaska and the North Slope, this factor is more prominent in May or June.
Question:. Are there signs the Arctic polar vortex is weakening since, say 1950, or some other date we have reliable tracking data from? Would this be in concert with the other data we have on old and new sea ice, etc. Do we have data on soil temperatures?