

Alaska August & Summer 2024 Climate Review
Alaska August & Summer 2024 Climate Review
Significant west to east contrast for temperatures and precipitation

****September 9 update: I’ve added Fig 3b showing the highest temperature reported in summer 2024***
August Summary
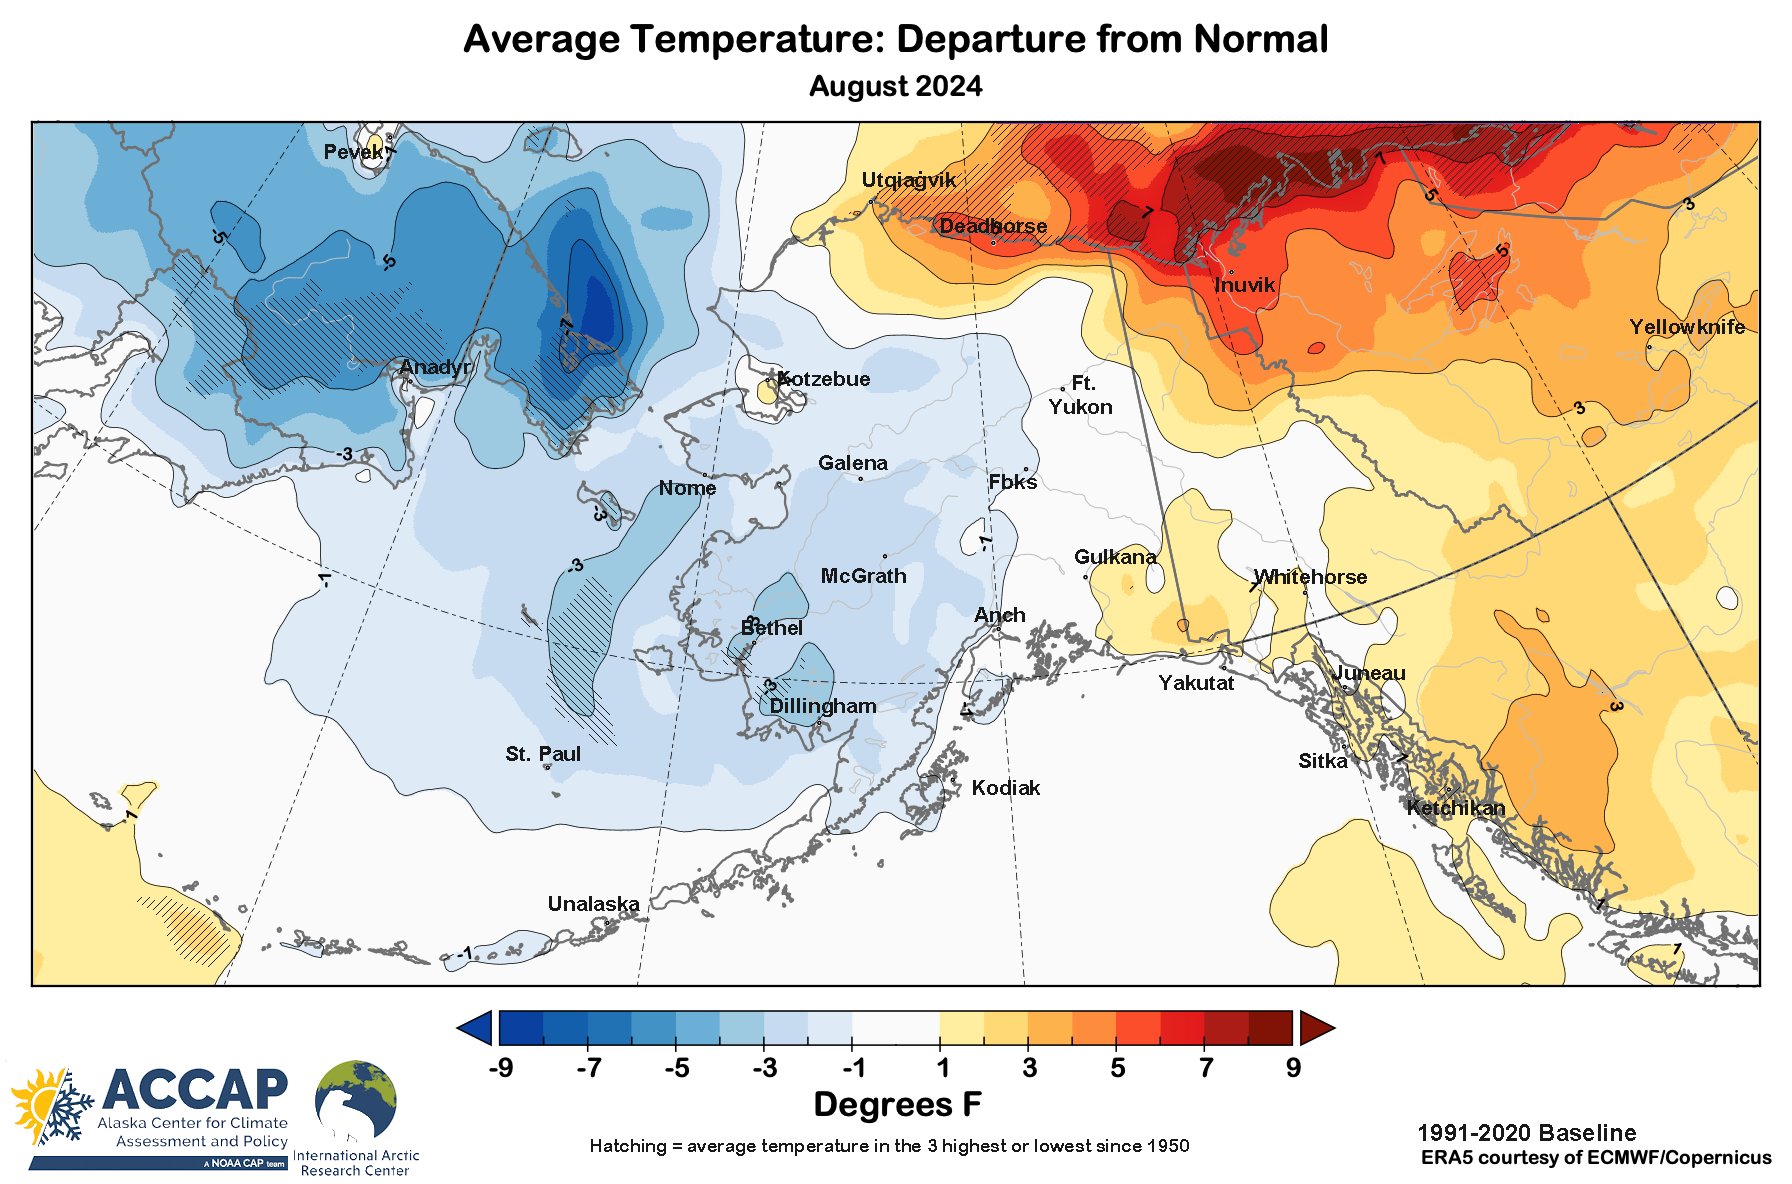
The major climate highlight in Alaska during August was the all-time record heat the first week of the month on the central North Slope coast. The high temperature of 89F (31.7C) at Deadhorse Airport on August 6 broke the previous record high of 85F July 13, 2016. This is also the highest temperature on record in Alaska north of 70°N. Nuiqsut reported a high temperature the same day of 88F (31.1C) Also of note was the short-lived heatwave near the Alaska-Yukon border on August 17-18. Northway's high temperature of 89F on August 18 was not only a record high for the month but also the highest temperature so late in the year (climate observations since fall 1942). Reliable temperature around Alaska during August ranged from 91F (32.8C) at the Tok 70 SE Climate Reference Network Station on 18th to 23F (-5.0C) at Chicken on the 21st.
Overall, August temperature departures from normal were broadly similar to July except on the North Slope, where August was quite a bit warmer than normal. Otherwise like July, cool in the west and warm in the east. Kotzebue had the coolest August since 1984 and Bethel the coolest since 1998. At Nome, the outstanding feature was the complete lack of any mild weather in August. The high temperature of 58F (14.4C) was the third lowest for any August in 118 years of climate observations, and the first time the temperature failed to reach 60F (15.6C) in August since 1998.
The ERA5 analysis of August temperature departures from 1991-2020 normal is shown in Fig. 1a and the site-specific departures are shown in Fig. 1b.
Precipitation
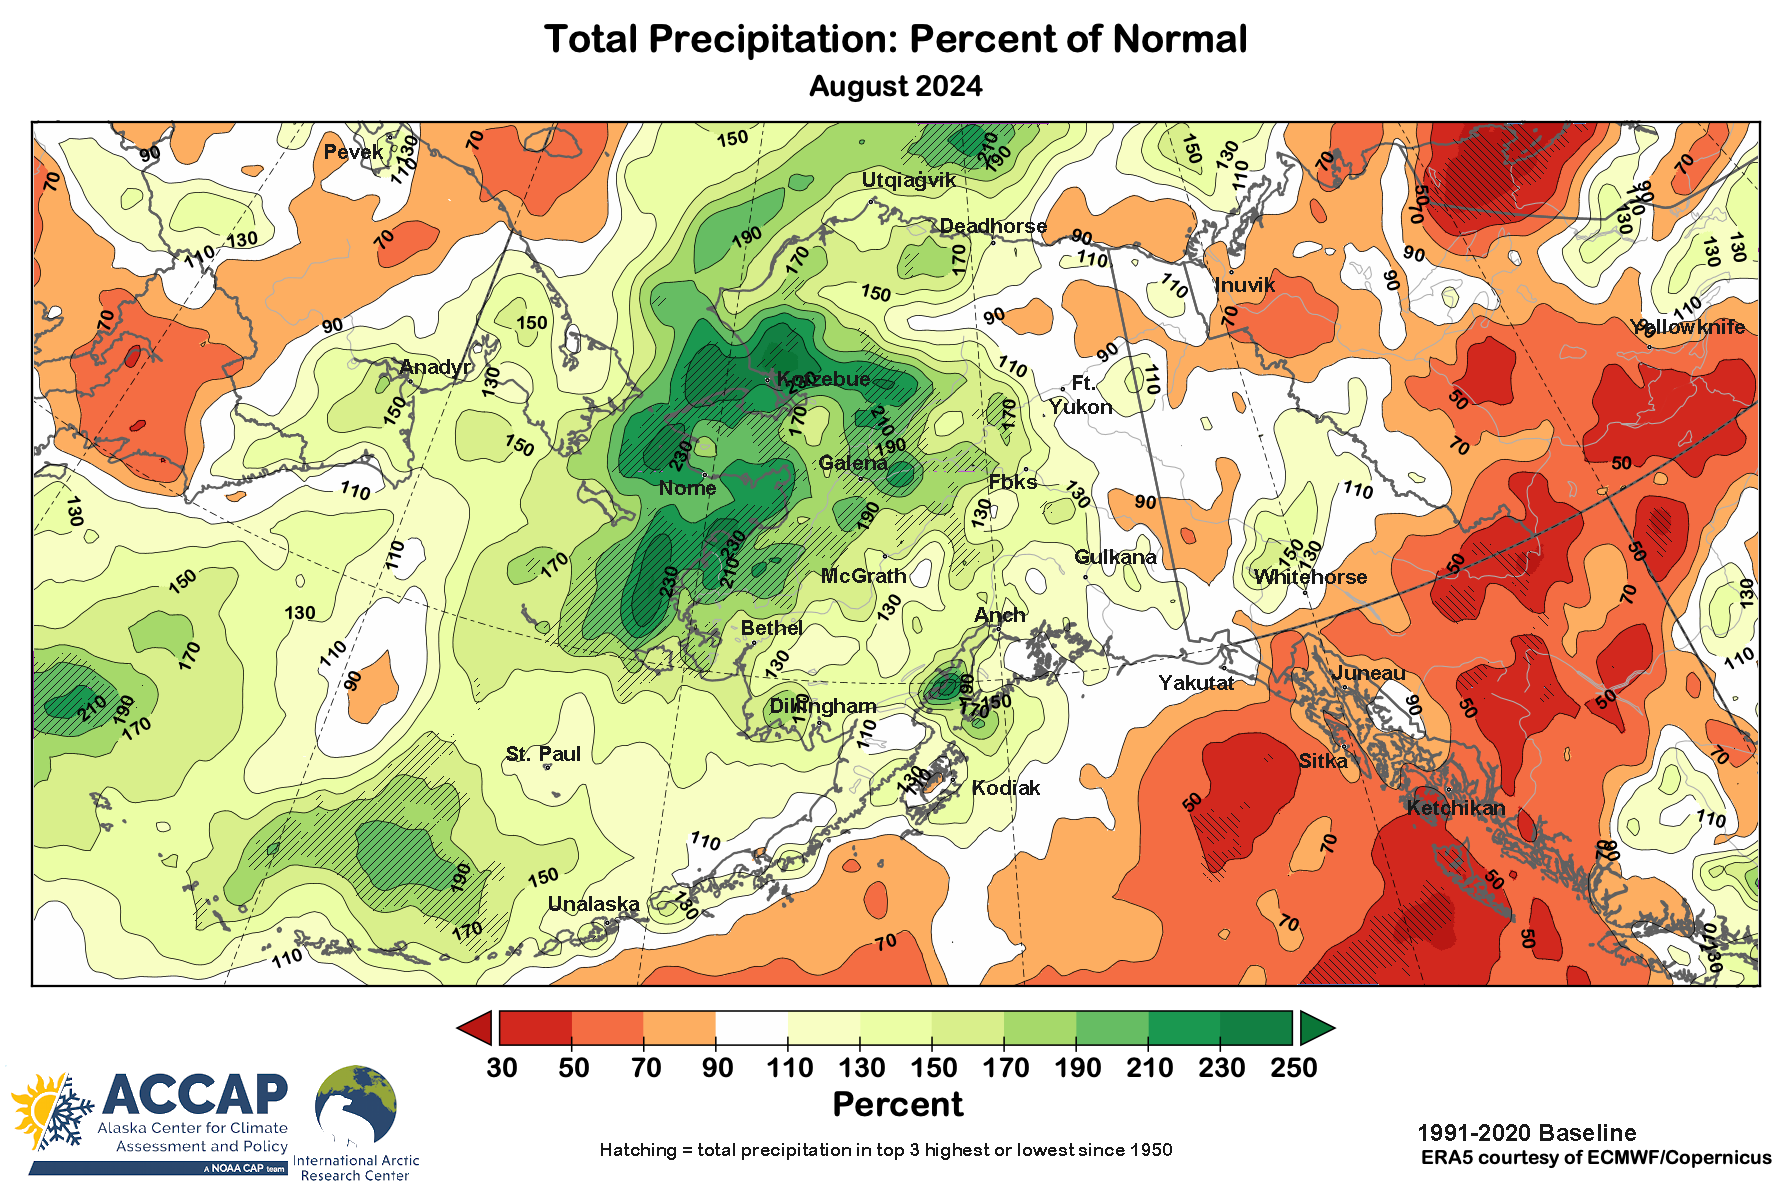
August was another very rainy month across western Alaska, but in a turnaround from July, nearly all of Southeast was drier than normal. At Nome 6.49 inches (165mm) was the highest rainfall in August since 1998 and at Kotzebue the highest since 2012. In contrast, Ketchikan had the driest August since 2018. The ERA5 analysis of August precipitation percent of 1991-2020 normal is shown in Fig. 2a and the site-specific percentages are shown in Fig. 2b.
Why don’t reanalysis and site-specific observations always match?
One of the most common questions I’m asked about reanalysis is along the lines of “how can we trust reanalysis when it differs from what station X reported?”
As a quick refresher, recall that reanalysis is from a weather weather model that starts off (initialized) with inputs from all kinds of observational systems (mostly but not entirely satellite-derived) and restarted two or more times a day with fresh observations. Site-specific observations are from “weather or climate” stations, in North America the vast majority of which are entirely automated.
Here’s a short, by no means complete list of how difference can and do arise:
Different scales involved: at 65°N, the nominal ERA5 grid cell is ~125 sq miles (325 km²), while site specific observations are effectively at a single point.
ERA5 monthly averages are the average of all the hourly values, i.e. for August the average temperature is the average of 744 hourly observations. For site-specific observations, the monthly average temperature is the average of the daily high and low, and there may be one to five days missing, while there are no missing time steps with ERA5 reanalysis.
ERA5 monthly averages are based on Greenwich Mean Time, while site-specific observations have different times for the 24-hour daily observations, which can have significant impact on monthly values if there are extremes on the first or last day of the month or if the daily observations are made around the time of daily temperature extremes.
ERA5 normals are simply the 30-year means. NOAA published normals are calculated as the means of the monthly values after “homogenization”, and this often include “black box” adjustments1 to the observed data in an attempt to account for non-climate changes, e.g. changes in sensor siting or exposure, time of observations, missing data, etc.
In situ observations have some uncertainty that is often not random but systematic, and except for the some parameters from NOAA climate reference network stations are based on single sensors that regularly go months to years between calibration checks. Since many of the in situ observations are from observation systems designed to support aviation, the acceptable error in sensors may be much larger than is appropriate for climate purposes.
Generally minimal quality control of in situ observations, whether in near-real time or (somewhat better) at archival time scales.
Summer 2024
Although it may not have felt like it, over a large part of Alaska, summer 2024 temperatures for the three months averaged close to normal, thanks to a very warm June over much of the state offsetting cooler weather later in the summer. The cooler weather in July and August in western and southwest Alaska won out, while in the eastern mainland and parts of Southeast warmth dominated. Probably the most notable departure was in the Bering Strait and on St. Lawrence Island, where this was the coolest summer since 2008 in ERA5 reanalysis.
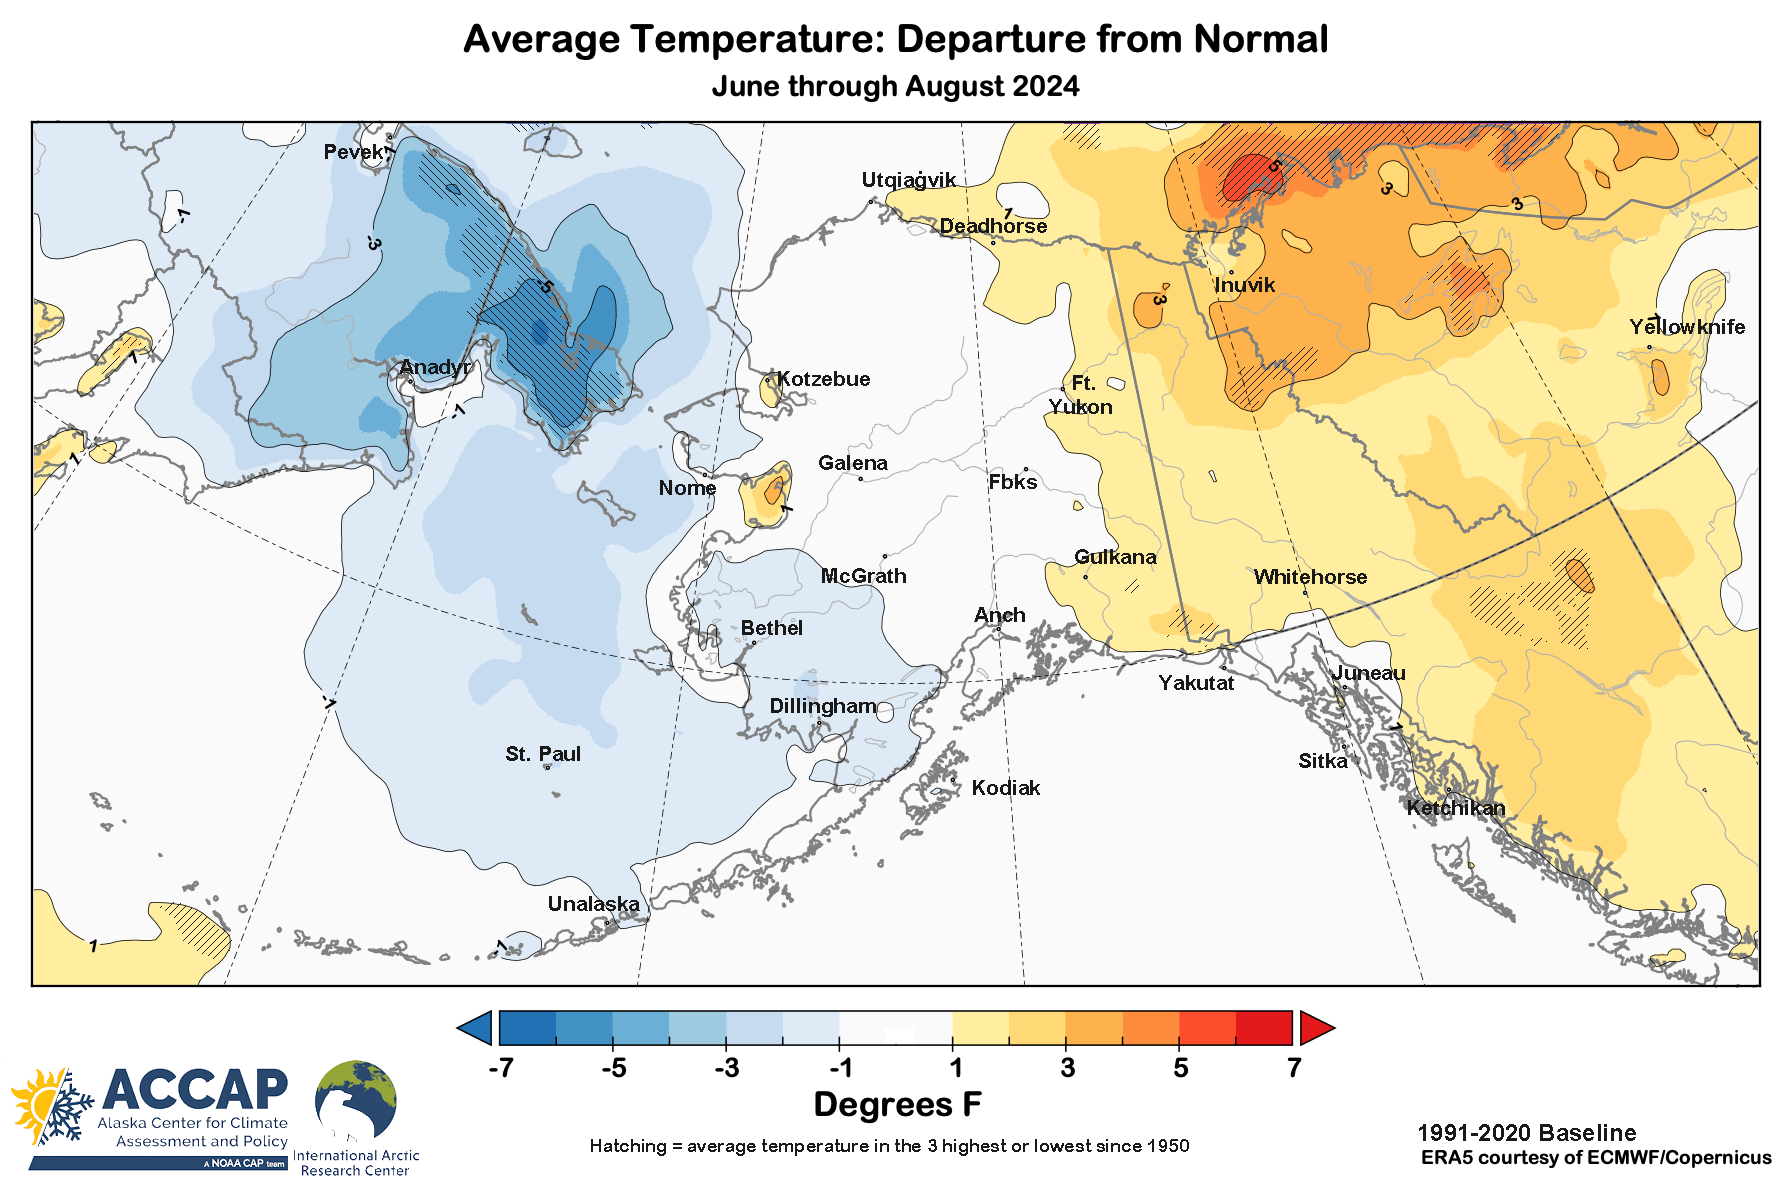
Figure 3am plots the site-specific highest temperature reported June through August 2024. Exceptional temperatures include the all-time record high temperatures on the central North Slope coast and in the Mackenzie River delta region and, although it was a cool summer overall on St. Lawrence Island, the 69°F at Gambell must be close to the all-time record high as well.
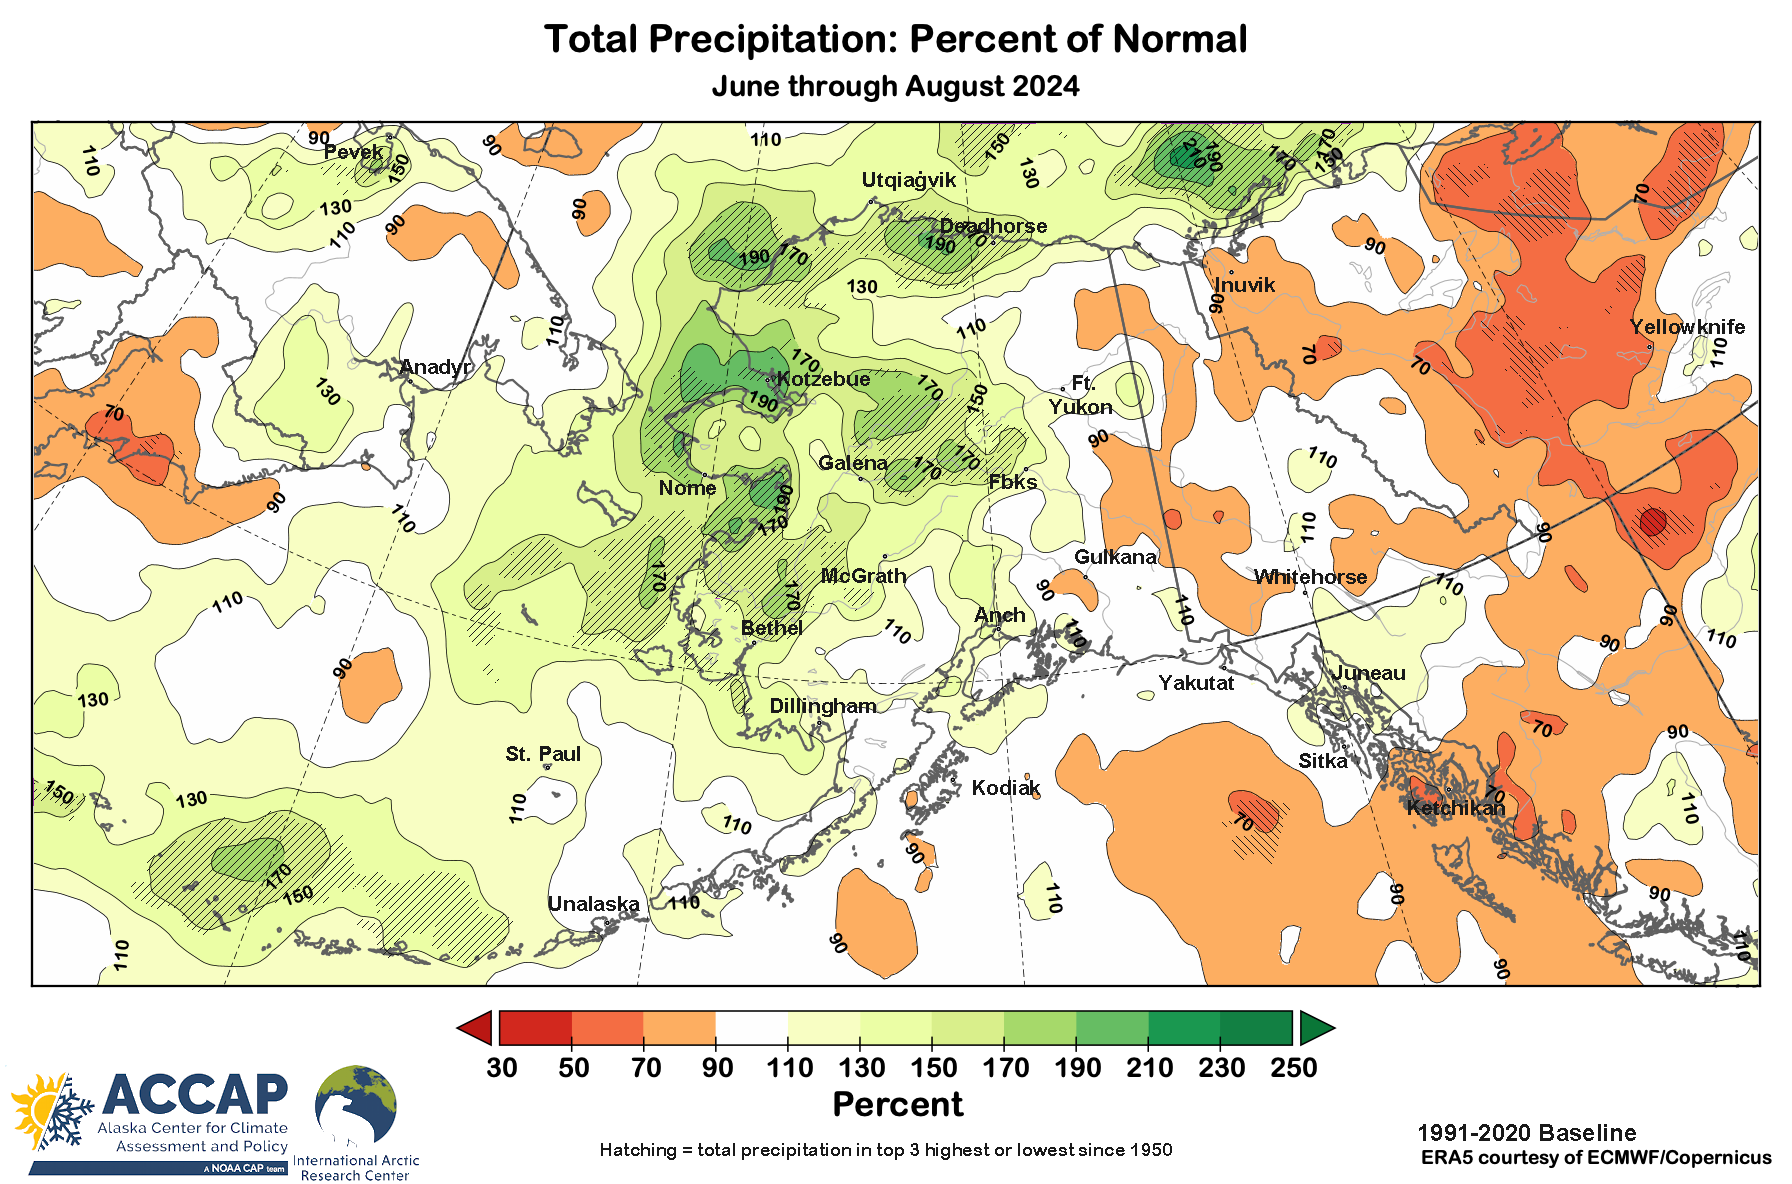
Rainfall-wise, while June was drier than normal over most of Alaska, in most areas except the eastern Interior June has the lowest normal rainfall, so the copious rain in July and August dominated over western and central areas. At Anchorage, this was the third consecutive summer with way about normal rainfall. In central and northern Southeast Alaska, the very wet July pushed totals for the summer up to near normal but southern Southeast had the driest summer since 2018 and Prince of Wales Island east to the Ketchikan area have been analyzed in moderate drought by the US Drought Monitor since early July.
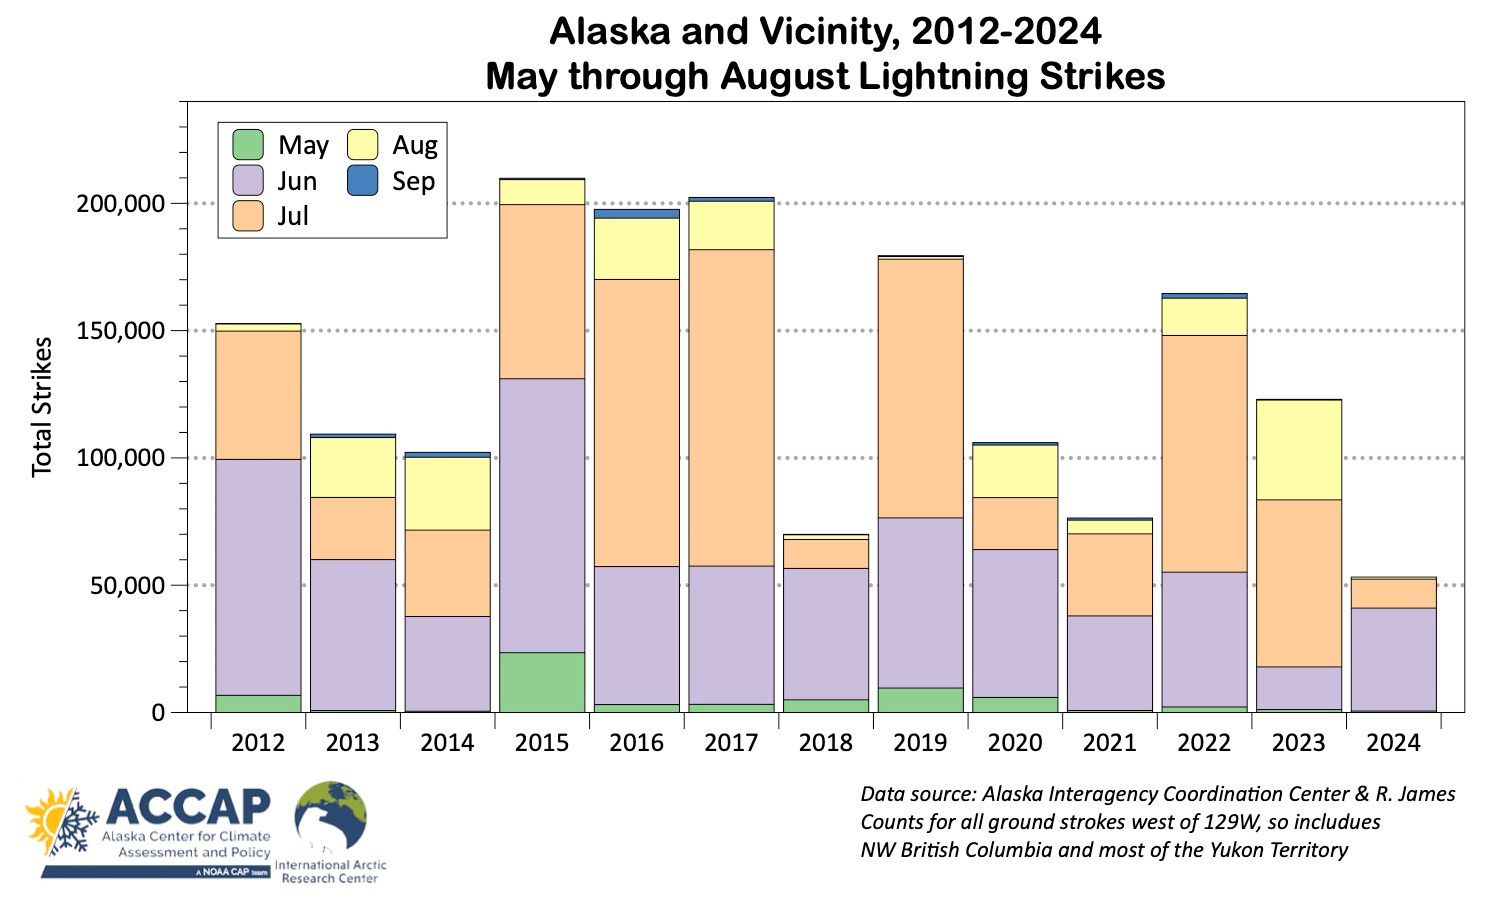
Summer 2024 Thunderstorms
Thunderstorm activity was very limited in Alaska and northwest Canada this summer. Based on detections from Alaska Fire Service lightning detection network, there were fewer strikes this summer than any since the current system came online in 2012, and most of these occurred in June. The seasonal lightning timing is reminiscent of summer 2018, but that summer July was warm and dry, and so quite different from this July.
Technical details:
Temperature and precipitation analysis spatial maps and time series from ERA5 reanalysis data from ECMWF/Copernicus, available here.
Code by B. Brettschneider/NWS Alaska Region allowing rapid ERA5 regional analysis is invaluable for my work.
Site-specific climate statistics and factoids from NOAA Regional Climate Center’s ACIS website here.
Site-specific rainfall percent of normals constructed from multiple automated station types but especially the Remote Automated Weather Stations operated by the Alaska Fire Service and the National Park Service. Other stations used include SNOTel (National Resources Conservation Service) and ASOS (NWS) sites and Environment and Climate Change Canada. ASOS and SNOTel and ECCC use 1991-2020 baseline normals and RAWS the 1981-2010 PRISM normals. Because in most of Alaska monthly precipitation trends are not large, at this scale “mixing” baseline periods is not expected to be a problem.
Richard James with Prescient Weather and author of the Deep Cold blog kindly provided the Alaska and vicinity lightning data acquired from the Alaska Fire Service.
The methodology is presented in Menne, M.J. and Williams Jr, C.N., 2009. Homogenization of temperature series via pairwise comparisons. Journal of Climate, 22(7), pp.1700-1717, link here. Nonetheless, it is “black box” in the sense that in general it’s not possible to reverse engineer adjustments that are applied to any given station, and in most cases in Alaska the assumption that there are nearby stations to base adjustments on is not met under any normal definition of “nearby”.
Thanks for sharing your observations and expertise, Rick!
Looks like a wash. The Chukshi Sea this year is a culprit for the western cooling?
Thanks for the report!